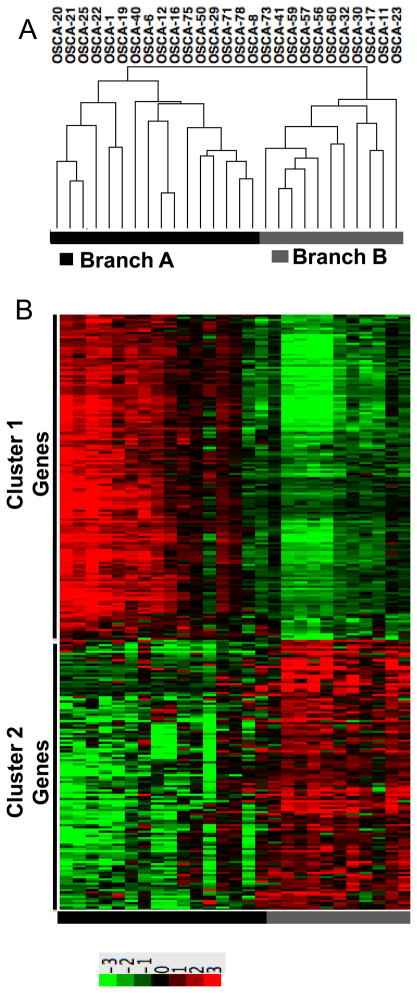
Figure 1. Unsupervised hierarchical clustering defines two osteosarcoma subtypes characterized by two reciprocal gene clusters.
(A) Unsupervised Clustering using expression data corresponding to 17,482 Entrez Gene IDs reveals two major branches in 26 dogs with osteosarcoma and one dogs with non-malignant osteomyelitis (OSCA 41), identified respectively as Branch A and Branch B in the toe bar. (B) Heat map showing 282 differentially expressed transcripts (p ≤0.0068, mean average fold-change >3) divided into two reciprocally expressed gene clusters (Gene Cluster 1 and Gene Cluster 2) between dogs in Branch A and Branch B. Heat map colors represent median-centered fold change expression following log2 transformation (a quantitative representation of the colors is provided in the scale at the bottom). Up-regulated genes are shown in red and down-regulated genes are shown in green.

