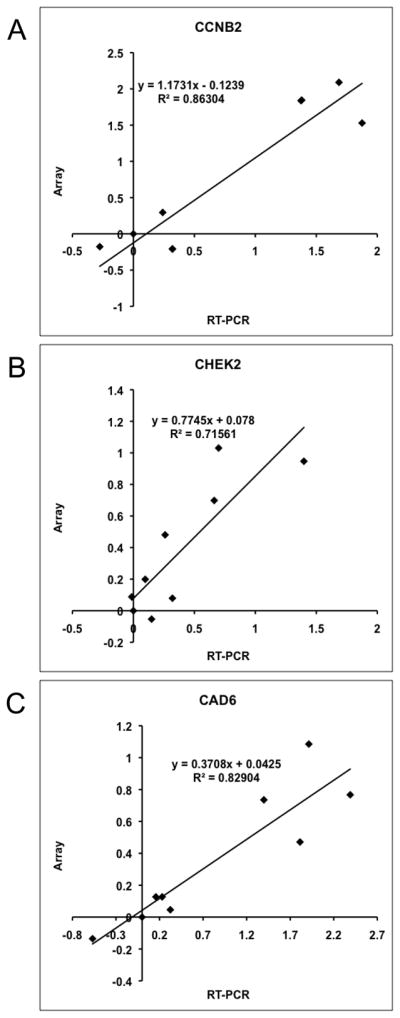
Figure 2. Correlation between qRT-PCR and array data in a subset of nine osteosarcoma cell lines.

Pearson correlation for expression of (A) CCNB2 (R2=0.86), (B) CHEK2 (R2=0.72); and (C) CADH6 (R2=0.83) genes. Each graph shows expression fold differences following normalization to GAPDH and relative to OSCA 41 (non-malignant osteomyelitis sample) for both the qRT-PCR on the x-axis and the microarray results on the y-axis. Data are shown as log10 for both quantification methods.
