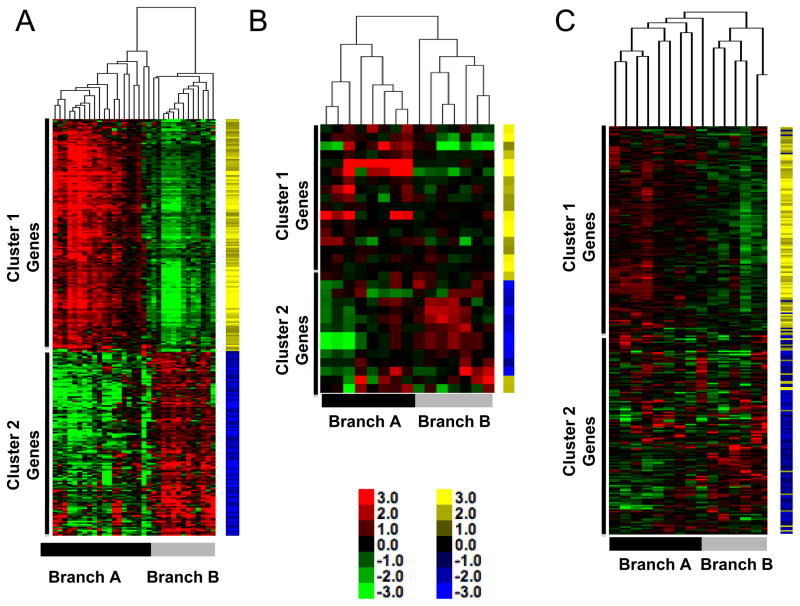
Figure 4. Gene expression signature with inverse gene clusters is present in three independent cohorts of dogs with osteosarcoma.
(A) Heat map of canine samples from Figure 1B with six additional samples derived from whole tumors. Data are shown relative to expression in cell lines. Yellow and blue tags identify specific gene vectors in the signature for tracking in panels B and C. Color intensity shows inter-sample variation. (B) Heat map of 15 canine samples from GEO GSE1608812 [13] using the gene list from Supplementary Table 3. The annotation for Affymetrix Canine1.0 array platform is limited, allowing only 31 genes to be mapped by name. (C) Heat map of 15 canine samples from GEO GSE24251 [14] using the gene list from Supplementary Table 3. The full complement of genes in Supplementary Table 3 was mapped to this cohort. Inverse gene expression patterns are present and gene vectors cluster together. Toe bars indicate the corresponding Branches (A and B), and clusters with predominance (<90%) of genes from Gene Clusters 1 and 2 are indicated for each sample cohort.

