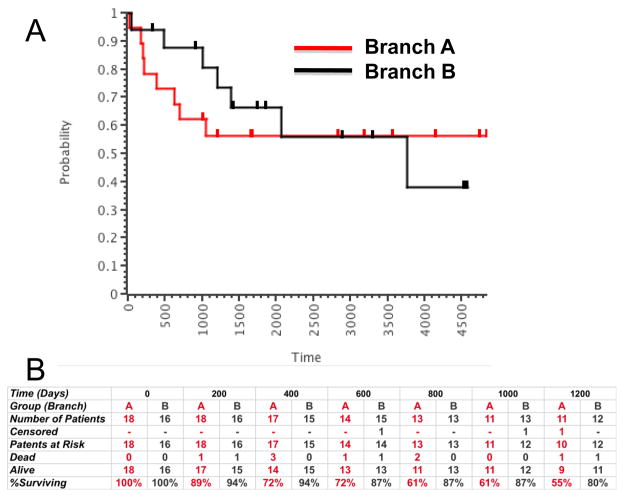
Figure 7. Kaplan-Meier survival analysis using groups defined by the clustering of orthologous canine genes in human samples.
Annotated survival data are from Paoloni [13]. (A) Overall survival for all patients at >4,900 days; censored patients that were alive at last follow-up are shown as tick marks above each line. The red line represents samples from Branch A and the gray line represents samples from Branch B. (B) Tabulation of early failures (deaths by 1,200 days, or ∼3 years) in 200-day intervals from patients in Branch A (red) and Branch B (gray), respectively.

