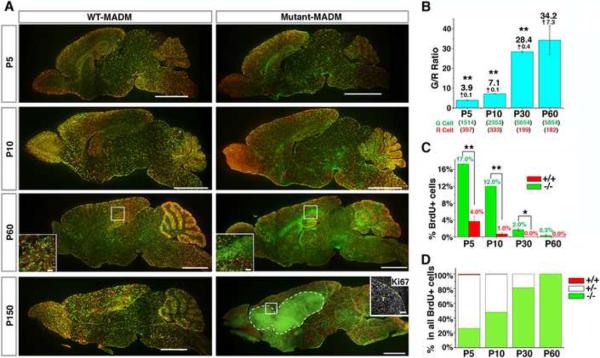
Figure 2. MADM-mediated sporadic concurrent inactivation of p53 and NF1 in embryonic NSCs reveals the entire process of gliomagenesis.
(A) Sagittal sections from brains of MADM mice at indicated ages. In WT-MADM mice (left column), both green and red cells are WT. In mutant-MADM mice (right column), green cells are p53 and NF1 double-null, red cells are WT. Tumor boundary is demarcated with dashed line. Scale bars: 2mm; Insets, 100μm. Ki67 staining shows that tumor cells are highly proliferative.
(B) Systematic quantification of G/R ratios in mutant-MADM brains from P5 to P60. Total cell numbers counted are shown in parenthesis. Each number is the sum from three brains.
(C) The percentage of BrdU+ cells in WT and mutant cell populations in the brain parenchyma of mutant-MADM mice at indicated ages.
(D) The proportion of BrdU+ cells with genotypes “−/−“, “+/−“, and “+/+” in the brain parenchyma of mutant-MADM mice at indicated ages. “+/−“ includes both double-colored and colorless BrdU+ cells. In (C and D) BrdU was administered 1.5 hours prior to sacrifice. Error bars +/− SEM; N = 3 mice. See Experimental procedures for sampling scheme. * P<0.05, ** P<0.01, paired T-test.
See also Figure S2.

