
Figure 5. Spatial analyses of early lesions based on perineuronal cytoarchitecture as a landmark implicate that glioma initiate at brain regions away from the SVZ.
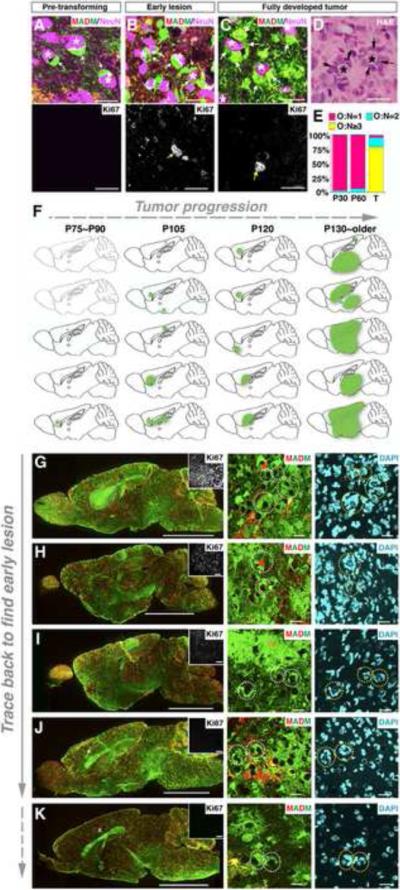
(A–C) Immunofluorescent staining of mutant-MADM brains at distinct tumorigenic stages. Neuronal nuclei were stained with NeuN and are marked as “*”. Arrows point to perineuronal pre-transforming OPCs or tumor cells. The proliferating status of perineuronal mutant cells is shown by Ki67 staining (yellow arrows in the bottom row).
(D) H&E staining of the adjacent section of (C) shows perineuronal satellitosis.
(E) Proportion of perineuronal structures with distinct mutant OPC-to-neuron ratios (O:N) either in pre-transforming MADM mutant brains (P30 and P60, N=3 brains each) or in tumors (T, N=4).
(F) Schematic summary of lesion sites (green spots), which are defined by O:N≥3 perineuronal structure together with MADM labeling, Ki67 staining, and also pathology in most cases. Brains devoid of any detectable lesions are shown in light gray. The analysis is based on a cohort of mutant-MADM mice induced by hGFAP-Cre.
(G–K) Representative brain images from (F) with gliomas from medium to small sizes. Insets show Ki67 staining of the tumor regions. The glioma identity in these brains was confirmed by pathological criteria except for (K), in which the perineuronal structure of ≥ 3 mutant OPCs suggests that it should be a lesion at its early stage.
Scale bars: (A–D), 20μm; (G–K): left column, 2mm; middle and right columns, 50μm.
See also Figure S5.