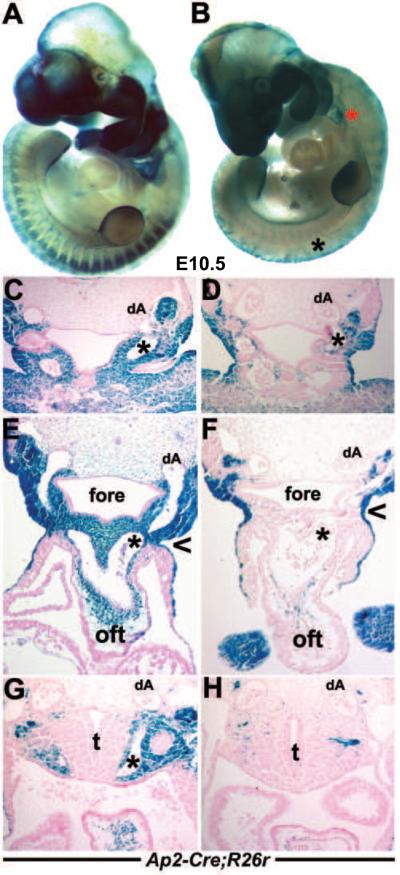
Figure 4. Ap2α-IRESCre;R26R lineage mapping of NC and their derivatives.
(A,B) Right lateral views of E10.5 wildtype (A) and Pax3Δ5 null (B) littermates illustrating reduced CNC population of Pax3 null 3/4/6th PAs (indicated by red * in B) and significantly diminished DRG (black * in B). However, Ap2α-IRESCre;R26R-marked cranial NC migration appears unaffected despite the presence of exencephaly in the Pax3 null mutant. (C–H) Histology through the 3rd (C,D), 4th (E,F) and 6th (G,H) arch regions of embryos shown in A and B. Sectioning confirmed reduced Ap2α-IRESCre-marked CNC around the Pax3 null 3rd PAA artery (indicated by * in D) and thyroid primordium (D), and around the Pax3Δ5 null 4th (indicated by * in F) and absent NC around the 6th (indicated by * in H) PAA. However, Ap2α-IRESCre ectodermal reporter expression (Macatee et al. 2003) is unaffected in Pax3 nulls (indicated via open arrowhead in F), as Pax3 in not expressed within the ectoderm. Note, only left PAA arteries and left dorsal aorta (dA) are indicated. Abbreviations: t, trachea; fore, foregut.

