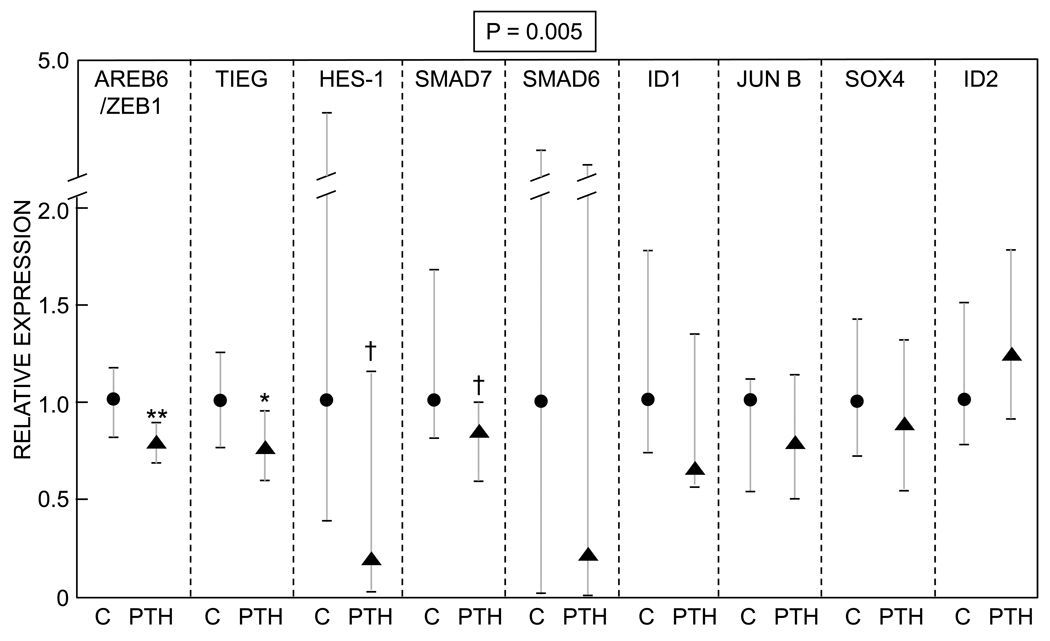
Figure 2.
Differences in BMP target genes in lin−/AP+ cells from control versus PTH treated subjects. Data are median and interquartile (25th–75th percentile) ranges. The numerical P-value is by the GSEA analysis, which provides a more robust means to analyze gene expression data and increases the power of detecting changes in genes occurring in pre-specified clusters, rather than in isolation (see Methods). **P < 0.01; *P < 0.05; †P = 0.07 versus control.

