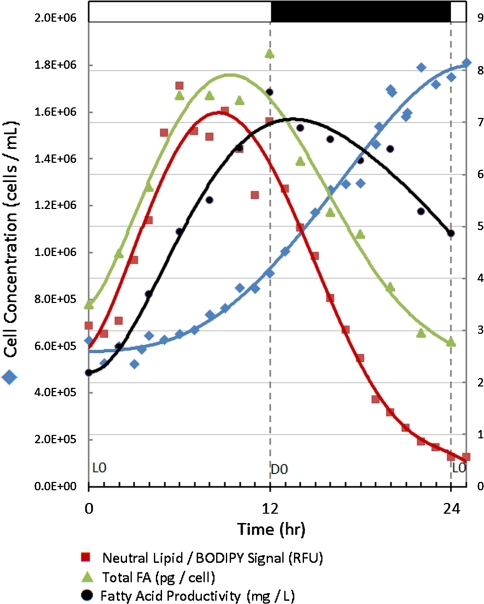
Fig. 2.
A comparison of cell cycle parameters Left axis: filled diamonds culture density (Coulter Counter). Right axis: filled squares neutral lipid concentration in relative fluorescent units (RFU), measured using BODIPY 505/515 dye; filled triangles Fatty acid per cell (picograms); filled circles fatty acid per liter of culture in mg using GC–MS. Error (by 95% confidence interval) for all data points is less than ~5%. Samples were run in quadruplicate

