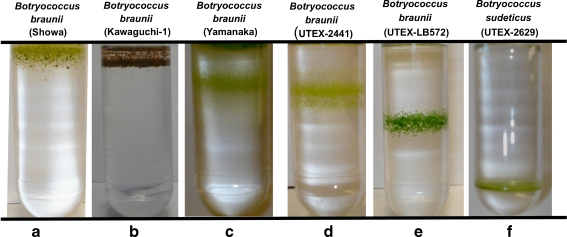
Fig. 4.
In vivo buoyant densities of various live Botryococcus cells, sorted according to increasing buoyant density of the samples. (a) Botryococcus braunii var. Showa, (b) Kawaguchi-1, (c) Yamanaka, (d) UTEX 2441, (e) UTEX LB572, and (f) Botryococcus sudeticus (UTEX 2629). A 10–80% (w/v) sucrose gradient was employed with a 10% increment among the gradient steps

