
Figure 4.
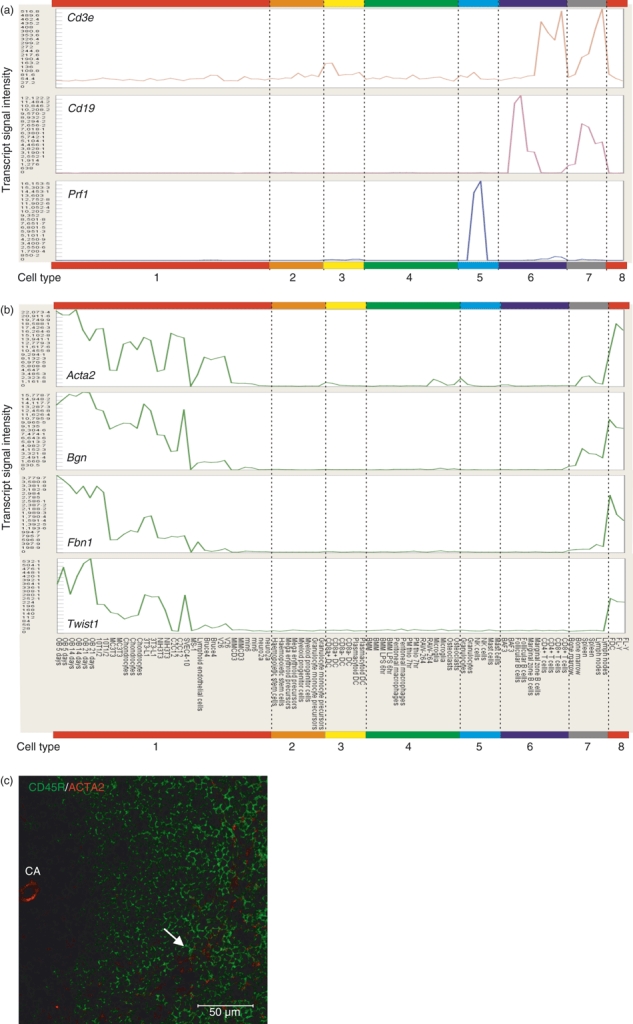
Mean gene expression profiles of selected marker genes over the 85 mouse cell samples. Samples are grouped according to cell type: 1, mesenchyme-lineage cells, embryonic stem cells, neurones; 2, bone marrow progenitor cells; 3, splenic classical dendritic cells (DC) and plasmacytoid DC; 4, phagocytes (bone marrow-derived, peritoneal, RAW-264 cells, osteoclasts, microglia); 5, granulocytes, natural killer (NK) cells and mast cells; 6, B and T lymphocytes; 7, tissues (bone marrow, spleen and lymph nodes); 8, follicular dendritic cells (FDC). (a) Cd3e (C_014), Cd19 (C_010), Prf1 (C_023). (b) Acta2, Bgn, Fbn1, Twist1 (all C_024). (c) Immunohistochemical analysis of mouse spleens shows ACTA2 expression (red) in association with FDC (arrowhead) in the B-cell follicles (CD45R, green). High levels of ACTA2 expression were also observed upon endothelial cells within the central arteriole (CA). Scale bar, 50 μm.