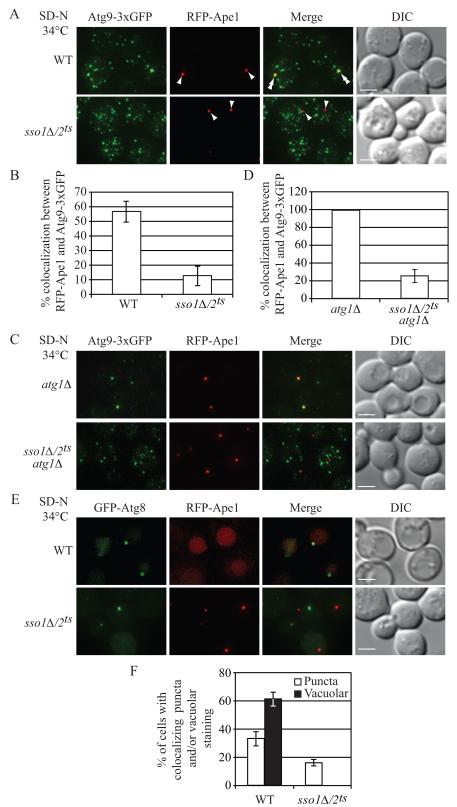
Fig. 3. Atg9 Anterograde Movement and Atg8 Localization Are Impaired in the sso1Δ/2ts Mutant.
Wild-type (WT, UNY145) or sso1Δ/2ts (UNY138) cells expressing Atg9-3xGFP and RFP-Ape1 were grown in rich medium to mid-log phase and shifted to NPT for 0.5 h. Incubation was continued for 0.5 h in nitrogen-starvation medium. The cells were fixed, and examined by fluorescence microscopy. For each picture, sixteen Z-section images were captured and projected. Arrowheads mark the position of RFP-Ape1 at the PAS, and double arrowheads mark overlaps of Atg9-3xGFP and RFP-Ape1. (A) Representative projected images.
(B) Quantification of colocalization. Error bars, standard error of the mean (SEM) from three independent experiments; n = 218 for the wild type, and 447 for the mutant.
(C) Representative projected images showing the transport of Atg9 after knocking out ATG1 in wild-type (UNY149) or sso1Δ/2ts (UNY140) cells.
(D) Quantification of colocalization. Error bars are SEM from three independent experiments; n = 150 for the wild type and the mutant. Scale bar, 2.5 μm.
(E) WT (UNY146) or sso1Δ/2ts (UNY147) cells expressing RFP-Ape1 and transformed with a plasmid encoding GFP-Atg8, were grown in SMD-Ura medium, shifted to NPT for 30 min, and incubated in nitrogen-starvation medium at the NPT for 1 h. Cells were fixed and fluorescence microscopy was performed.
(F) Quantification of colocalization. The error bars indicate the SEM; n = 256 for wild type, and 310 for the mutant. Scale bar, 2.5 μm. DIC, differential interference contrast. See also Figure S3.

