Figure 3.

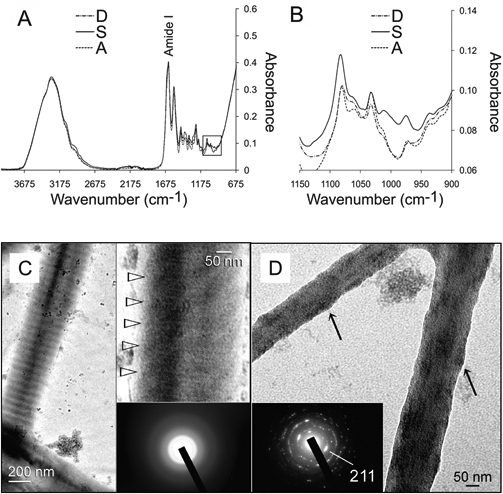
Collagen mineralization in the presence of sodium trimetaphosphate. (A) Infrared spectra (4000-675 cm−1) of demineralized collagen matrices (spectrum D), followed by chemical phosphorylation with 2.8 wt% hydrolyzed and pH-adjusted sodium trimetaphosphate (spectrum S) and dephosphorylation with alkaline phosphatase (spectrum A). (B) High magnification of the 3 spectra (1150-900 cm−1) from the region depicted by the square box in (A). (C) Unstained images of reconstituted collagen phosphorylated with HPA-Na3P3O9 after 24 hrs of immersion in the polyacrylic-acid-containing mineralization medium. A banded fibril showing electron-dense mineral phases along the fibril surface (arrow). Top inset: High-magnification view of the periodicity (open arrowheads) within the fibril, which is suggestive of an ordered deposition of mineral phases. Bottom inset: Selected area electron diffraction (SAED) showing that the intrafibrillar minerals were amorphous at this stage. (D) More highly mineralized fibrils from the periphery of the grid space showing intrafibrillar nanocrystals. These fibrils appear shrunken, since loosely bound water within the internal compartments of the fibrils was replaced by minerals, resulting in elevations along the fibrillar surfaces (arrows). Inset: SAED of the intrafibrillar minerals showing arc-shaped concentric rings characteristic of apatite.
