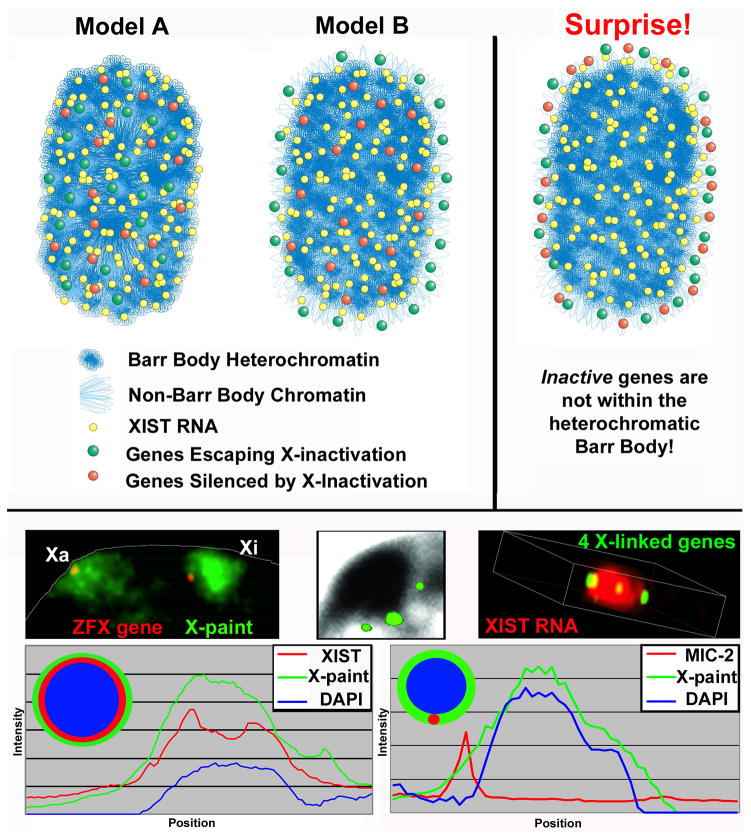
FIGURE 5. An unanticipated finding that inactive X-linked genes are predominantly not located within the heterochromatic Barr body (BB).
A) Two theoretical models of gene organization on Xi (left) and the model supported by empirical results (right). Initially, it was presumed that either (Model A) escape from silencing is controlled at the local level and all genes are located within the BB or (Model B) genes escape inactivation by positioning outside XIST RNA and the Barr Body with silenced genes well within the heterochromatic BB. However, the data supports the surprising result that all genes positioned with high probability on the outer border of the XIST RNA territory, outside the Barr Body. B) Examples of gene organization relative to the Xi and Xa DNA chromosome territory (left), Barr Body (middle), and XIST RNA (right). Left shows one gene at a peripheral position relative to the DNA territories of Xi and to a lesser extent Xa. Note: the densely packed interior region of the Xi is evident in contrast to a more extended conformation of the Xa. Middle shows three X-linked genes located just outside the DAPI dense BB. Right shows a 3D still-shot of a video showing four X-linked genes at the outer edge of the XIST RNA paint (from Clemson et al., 2006). C) The linescan on the left, through the Xi of one nucleus, shows relative sizes of the BB (DAPI), the XIST RNA painted region, and the X-chromosome DNA territory (X-paint). The BB comprises 62% of the X-territory and 87% of the XIST RNA paint, while the XIST RNA region covers 80% of the X-territory. The linescan on the right shows the position of an X-linked gene (MIC-2) just outside the BB and at the outer edge of the X DNA territory. Adapted from Clemson et al., 2006.

