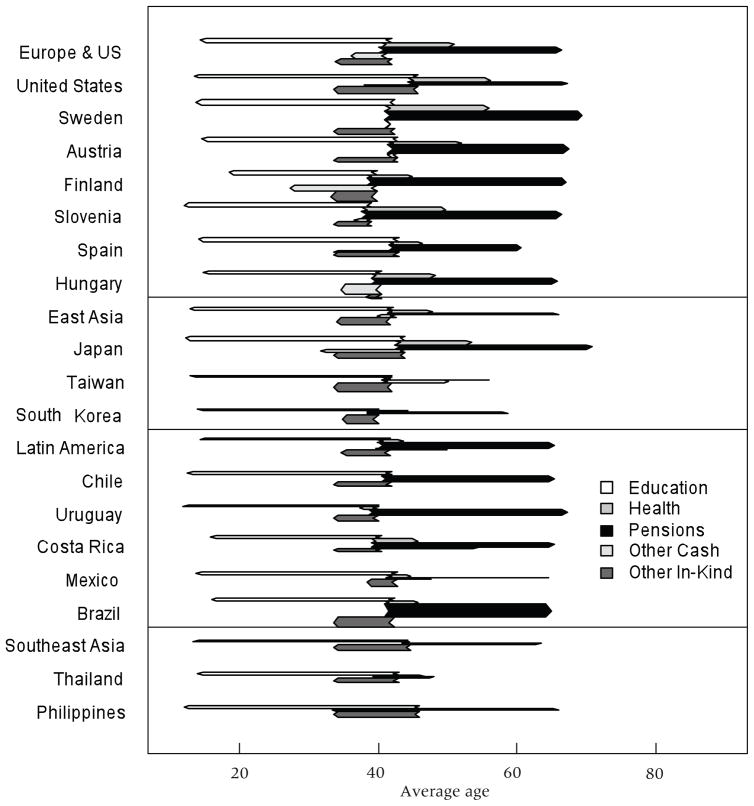
FIGURE 12. Average age of public sector flows, using age distribution averaged across all countries.
NOTE: Arrow point is average age of inflow; arrow tail is average age of outflow. Outflow age profile same for all sectors, adjusted to match aggregate inflow. Width is average of per capita inflow and outflow relative to average labor income over ages 30–49. Area is implied wealth. Within region, country order by ppp-adj avg GDP.

