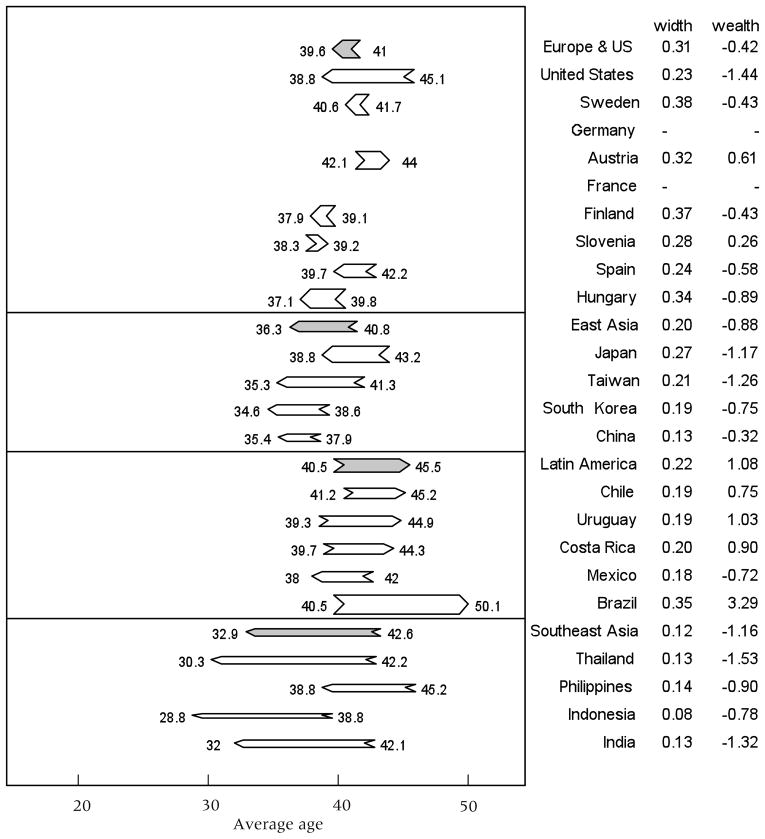
FIGURE 9. Average age of public transfer inflows (TGI) and public transfer outflows (TGO), using age distribution averaged across all countries.
NOTE: Arrow point is average age of TGI; arrow tail is average age of TGO; width is the annual per capita flow in the population relative to labor income over ages 30–49. Area within arrow is implied wealth. Within region, country order by ppp-adj avg GDP.

