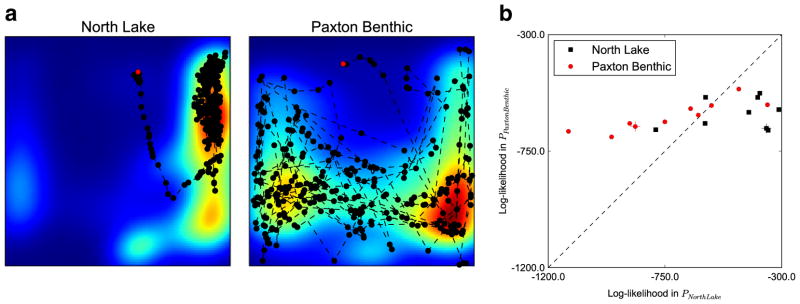
Fig. 4.
Population positional distributions are representative of individual behavioral patterns. a Tracks of a single stickleback (hatched individual from (b)) superimposed on its population heat map. Red dots indicate the starting position of the fish. b Log-likelihood analysis of the North Lake and Paxton Benthic populations. Individual sticklebacks are represented by dots: Black squares, North Lake; red circles, Paxton Benthic. Hatched individuals are featured in (a)

