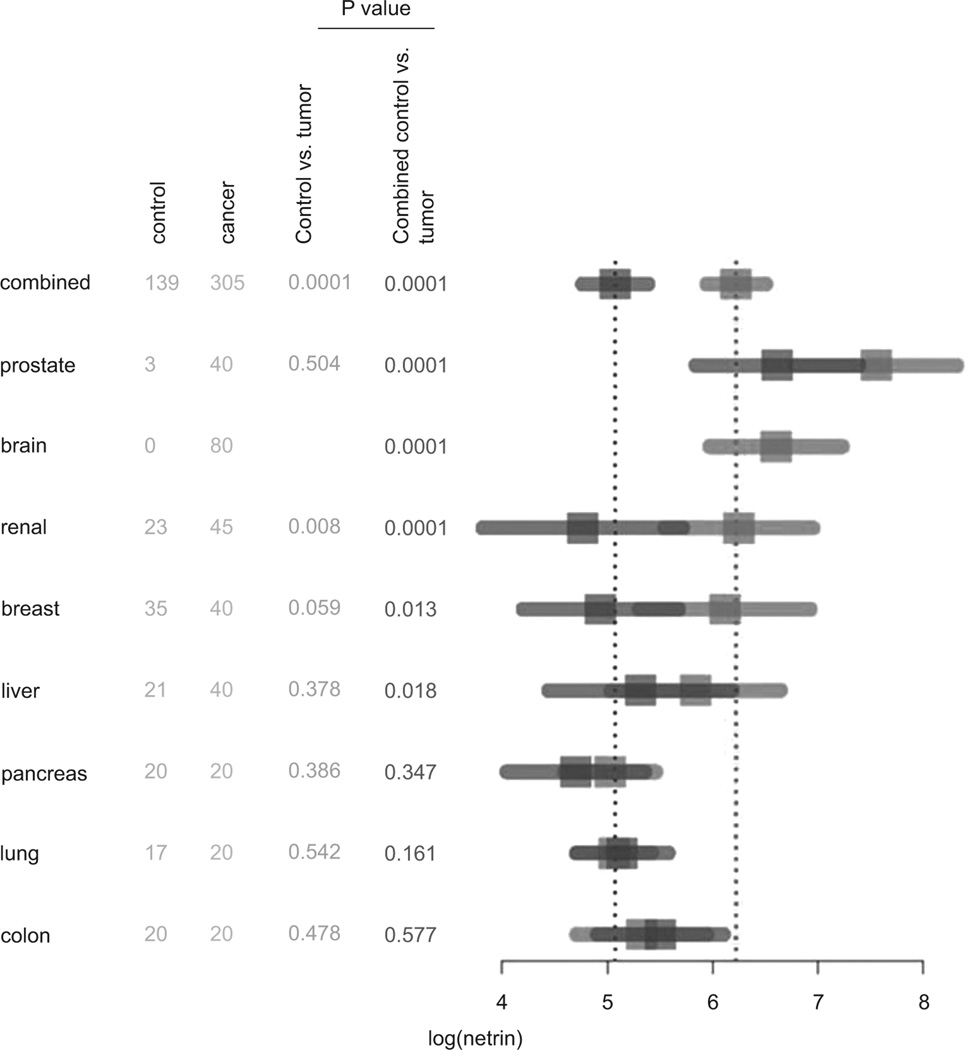
Figure 2.
Summary of netrin-1 measurements and depiction with a forest plot. For the different cancer types, sample sizes, p-values, and 95% confidence intervals for the mean netrin-1 level are provided. The nonparametric Mann-Whitney test was used to compare the cases to controls or combined controls yielding the reported p-values. The graphic demonstrates the increased netrin-1 levels over the combined controls in the prostate, brain, renal, breast, and liver cancers. P value less than 0.05 was considered significant.

