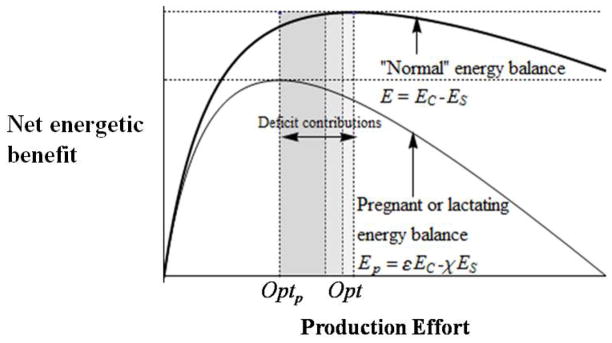
Fig. 3.
Deficit contribution (D) of an individual female resulting from her greater consumption εEC and greater expenditure χES reducing her optimal production from Opt (see intersection of lines in Fig. 2)) to Optp. This deficit is decomposed into three components: (1) processing effort deficit toward G (darkest region between Opt and Optp); (2) foraging effort deficit toward G (second darkest region); and (3) foraging and processing effort deficit toward H.

