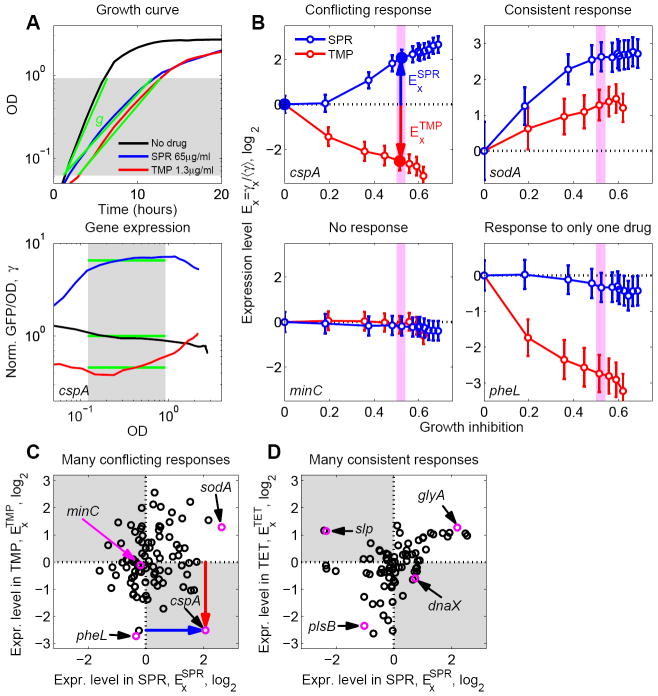
Figure 2. Gene regulation responses to pairs of antibiotics frequently show conflicts.
(A) Example data demonstrating measurement of drug effect on growth rate and transcription reporters. Optical Density (OD) and GFP expression from various promoters (shown, as an example, is the cspA promoter) are measured as a function of time for various drug concentrations. Shown are no drug (black), 65μg/ml SPR (blue), and 1.3μg/ml TMP (red). Top: Growth rates are defined by linear regression (green lines) to the OD curves. Bottom: Expression level γ (green lines) is defined as GFP fluorescence intensity per OD, averaged over an OD range of exponential growth (shaded region) and normalized to no drug control (thus γ = 1 for the no drug control). (B) Normalized expression levels Ex of example promoters cspA, sodA, minC, and pheL as a function of growth inhibition in various concentrations of SPR (blue) and TMP (red). Growth inhibition is the fraction by which the growth rate in the absence of drug is reduced. For each promoter X, Ex is defined as expression level γx, normalized to the median expression level ⋨γ⋩ of all promoters in the same drug concentration (Experimental Procedures). The three larger filled points for cspA correspond to the drug concentrations shown in A. The promoter cspA shows a clear regulatory conflict for these two drugs. In contrast, sodA is consistently up-regulated in response to both drugs while pheL is only regulated in response to TMP and minC shows no response to either drug. (C) Scatterplot of versus (changes in expression at inhibition level indicated by light magenta bands in panels B, g=0.45-0.5, cf. red and blue arrows in B) for a genome-wide sample of promoters (Table S1). Promoters with regulatory conflicts (e.g. cspA, magenta), are located in the gray quadrants. Promoters that respond to only one of the drugs (e.g. pheL, magenta), are located near the horizontal and vertical dotted lines. Promoters showing the same qualitative response to both drugs (e.g. sodA, magenta), are located in the white quadrants. Note that many promoters show conflicts for this drug pair. (D) As C but for TET-SPR drug combination. Most promoters lie in the white quadrants, showing that conflicts occur less frequently for this drug pair. However, some promoters show conflicts (e.g. slp and dnaX, magenta). Error-bars in (B) correspond to two standard deviations estimated from replicate measurements done on different days (Experimental Procedures).

