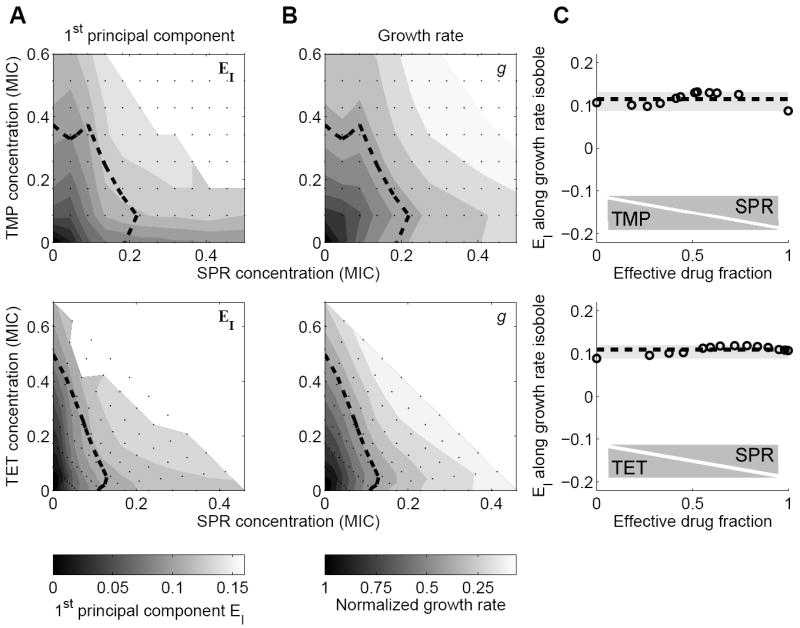
Figure 4. The first principal component of the gene regulation response captures the effects of growth rate changes.

(A) First Principal Component (PC) of gene expression response to two-drug environments TMP-SPR (top) and TET-SPR (bottom). Dashed line: line of constant growth rate (normalized growth rate g=0.5). White region in top right: No data due to low growth rates (Experimental Procedures). (B) Growth rate in two-drug environments TMP-SPR (top) and TET-SPR (bottom). Note similarity to corresponding 1st PC shown in B. (C) 1st PC along isobole g=0.5 (dashed line in A, B) as a function of the ‘effective drug fraction’ (see Experimental Procedures for formal definition). This PC is approximately constant along isoboles, showing that the first PC simply captures a generic transcriptional response to growth rate change, which is drug-independent.
