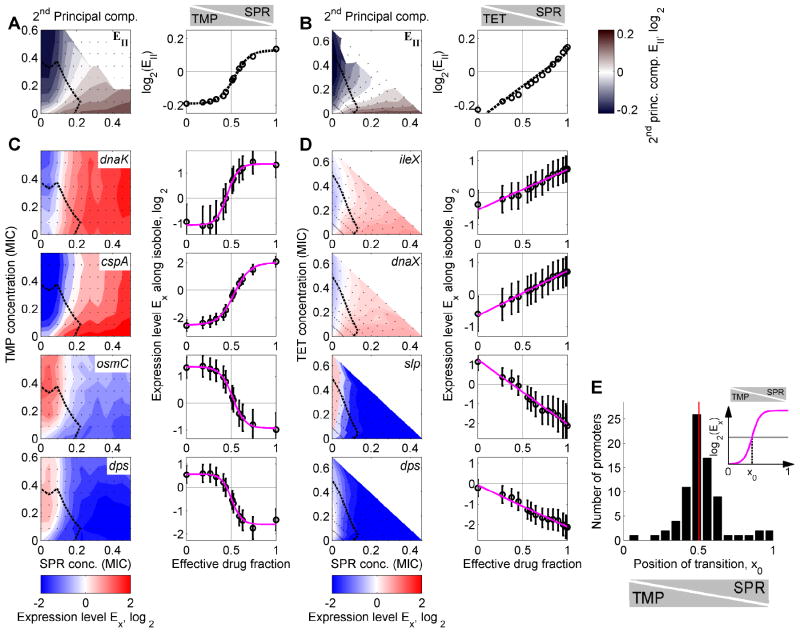
Figure 5. Bacteria resolve gene regulatory conflicts by prioritizing their response to one of the drugs or by averaging the responses to the individual drugs.
(A) 2nd PC of the global transcriptional response to TMP-SPR in color code (left panel). Blue indicates down-regulation, red up-regulation, and white no change in gene expression. Dashed black line: Growth rate isobole g=0.5. The 2nd PC shows a gene regulatory conflict and how it is resolved in the two-dimensional drug concentration space. Right panel: 2nd PC along growth rate isobole g=0.5. Note the nonlinear shape of the transition; dashed black curve, sigmoidal fit (Experimental Procedures). (B) As A but for TET-SPR. Note the linear shape of the transition in the right panel; dashed black curve, linear fit (Experimental Procedures). (C) Expression levels of genes dnaK, cspA, osmC, and dps in two-dimensional drug concentration space of TMP-SPR. Gene expression levels along the growth rate isobole (dashed black line, normalized growth rate g=0.5) are shown on the right. Magenta lines: sigmoidal fits (Experimental Procedures). Conflicts in gene expression are resolved in a prioritized response, leading to a relatively sharp transition between the conflicting expression levels as TMP is continuously replaced with SPR (cf. Figure 1B). (D) As B, but for different example genes ileX, dnaX, slp, and dps, which show conflicts in the two dimensional drug concentration space of TET-SPR. Magenta lines: linear fits (Experimental Procedures). Conflicts in gene expression are smoothly averaged, leading to a linear transition between the conflicting expression levels (cf. Figure 1B). (E) Inset: Schematic of sigmoidal fits to curves from (A,C) with fit parameter x0 characterizing the position of the transition between the two different gene expression responses. Histogram of fit results for x0 for drug combination of TMP-SPR (Experimental Procedures). The distribution of x0 is narrowly localized around 0.5 showing that the response of most genes is not biased towards either of the drugs (cf. Figure 1C) though a few genes are biased towards TMP (bars near x0=1). Error-bars correspond to two standard deviations estimated from replicate measurements done on different days (Experimental Procedures).

