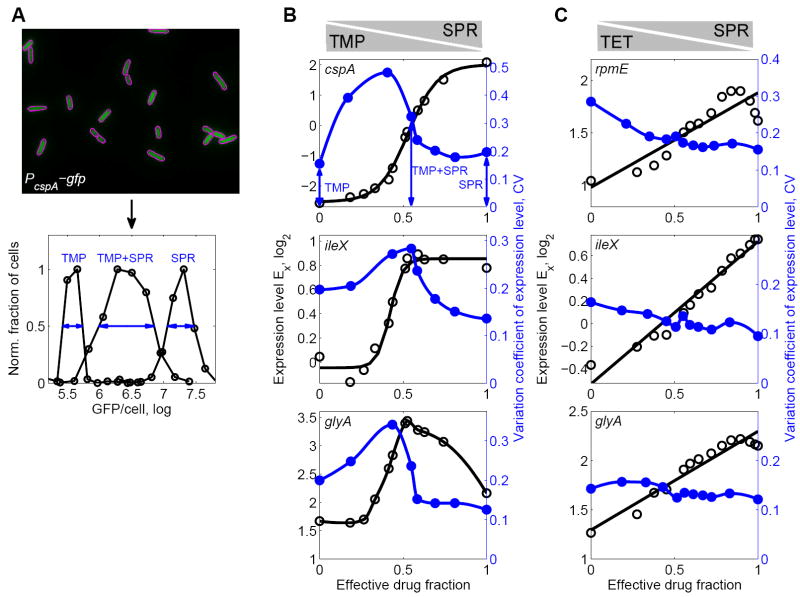
Figure 7. Prioritized response coincides with increased cell-to-cell gene expression variability in the drug combination.
(A) Top: GFP fluorescence from E. coli cells. In this example, GFP is driven by the cspA promoter. Magenta outlines show segmentation (Experimental Procedures). Bottom: Histogram of GFP intensities per cell in TMP alone (left), SPR alone (right) and the combination of TMP-SPR (middle). While the distributions of gene expression levels are unimodal in all conditions, a much wider distribution is observed when TMP and SPR are present simultaneously (blue arrows). (B) Population average measurements of expression level Ex (black circles) along growth rate isobole g = 0.5 as in Figure 5C, for promoters cspA, ileX, and glyA in TMP-SPR drug combination. Black lines are sigmoidal fits (cf. Figure 5) except for glyA where black line shows cubic spline. Blue circles show variation coefficient of GFP/cell along a similar growth rate isobole. The coefficient of variation (CV) is a measure of the relative cell-to-cell variability in gene expression and defined as the empirical standard deviation of GFP/cell (shown in A) divided by its mean (Experimental Procedures). Blue lines are cubic splines. Gene expression cell-to-cell variability peaks in drug combination near the point where a sharp transition between two different responses occurs. (C) As B but for TET-SPR showing promoters rpmE, ileX, and glyA which have regulatory conflicts in this drug combination. Note that gene expression cell-to-cell variability does not peak in the drug combination.

