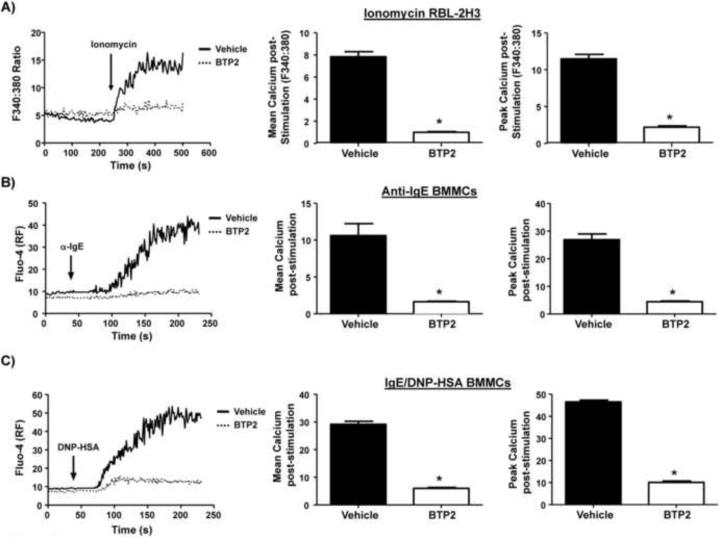
Figure 1. BTP2 blocks intracellular calcium mobilization in RBL-2H3 cells and BMMCs.
(A) RBL-2H3 cells were pre-treated with BTP2 (1 μM) or vehicle (DMSO) for 30 min, then analyzed for calcium responses as described in the materials and methods following stimulation with 500 nM ionomycin in the presence of CaCl2 for the indicated time period. [Ca2+]i was expressed as ratiometric Fura-2AM, and representative data of 3–5 independent experiments is shown (left panel). Quantification of mean calcium increase (middle panel); peak calcium increase (right panel), with data expressed as the mean ± SEM of 3–5 independent experiments. *p<0.05 vs. Vehicle. (B) BMMCs were pre-treated with BTP2 (1 μM) or vehicle for 30 min, then stimulated with mouse anti-DNP IgE and rat anti-mouse IgE (10 μg/mL), and analyzed as in (A), except that [Ca2+]i was expressed as Fluo-4 relative fluorescence with representative data of 3–5 independent experiments shown (left panel). Quantification of mean calcium increase (middle panel); peak calcium increase (right panel) as in (A). Data are expressed as the mean ± SEM of 3–5 independent experiments. *p<0.05 vs. Vehicle. (C) BMMCs were pre-treated with BTP2 (1 μM) or vehicle for 30 min, then stimulated with 100 ng DNP-HSA and analyzed as in (A), except that [Ca2+]i was expressed as Fluo-4 relative fluorescence with representative data of 3–5 independent experiments shown (left panel). Quantification of mean calcium increase (middle panel); peak calcium increase (right panel) as in (A). Data are expressed as the mean ± SEM of 3–5 independent experiments. *p<0.05 vs. Vehicle.

