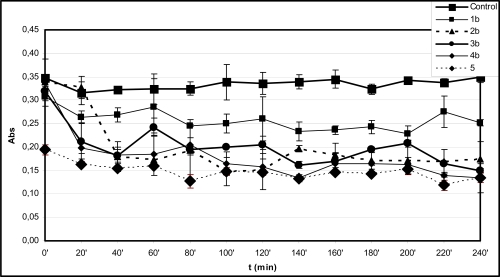
Fig. (2B).
Time-course of degradation of deoxyribose in the presence of 1b-4b and quercetin (5) (200 µM) using 36 µM EDTA and 50 µM H2O2.
*Each absorbance (Abs) (λ=532 nm) is the average of three parallel measurements ± standard error. Details of incubation and derivatization is written in the Materials and Methods part.

