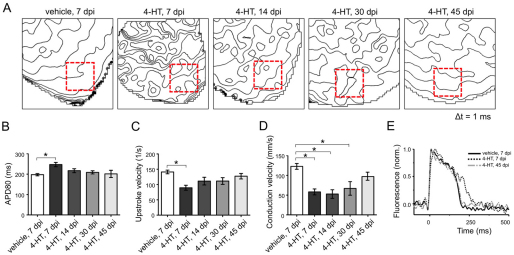
Fig. 7.
Electrical properties of ventricular cardiomyocytes after widespread ablation. (A) Isochronal maps of ventricular apices from vehicle- or 4-HT-injected Z-CAT fish at indicated time points display the position of the action potential wavefront at 1 ms intervals (Δt=1 ms). Squares show regions of interest (ROIs; 156×156 μm) for epicardial surface conduction velocity estimation shown in D. (B,C) Action potential duration estimated from 20% depolarization to 80% repolarization (APD80) (B), and derived maximum upstroke velocities (C). Mean±s.e.m. *P<0.05, at 7 dpi and non-significant (NS) at 14, 30 and 45 dpi; one-way ANOVA with Tukey's HSD for comparisons with ventricles from vehicle-injected fish. (D) Mean estimated surface myocardium conduction velocities from ROIs in A. Mean±s.e.m. *P<0.05 at 7, 14 and 30 dpi and NS at 45 dpi; one-way ANOVA with Tukey's HSD for comparisons with ventricles from vehicle-injected fish. (E) Representative traces of surface action potentials, indicating a slowing of the maximum depolarization rate and an increase in action potential duration at 7 dpi, and their recovery at 45 dpi.

