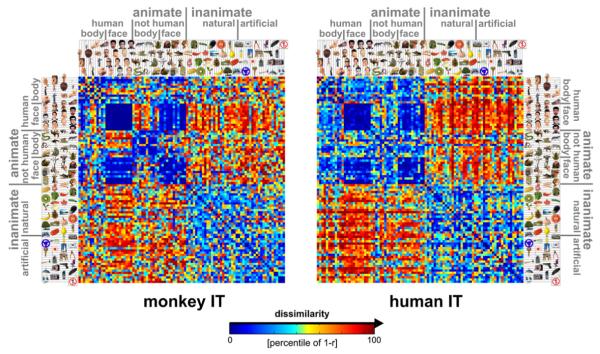
Figure 1. Representational Dissimilarity Matrices for Monkey and Human IT.
For each pair of stimuli, each RDM (monkey, human) color codes the dissimilarity of the two response patterns elicited by the stimuli in IT. The dissimilarity measure is 1 – r (Pearson correlation across space). The color code reflects percentiles (see color bar) computed separately for each RDM (for 1 – r values and their histograms, see Figure 3A). The two RDMs are the product of completely separate experiments and analysis pipelines (data not selected to match). Human data are from 316 bilateral inferior temporal voxels (1.95 × 1.95 × 2mm3) with the greatest visual-object response in an independent data set. For control analyses using different definitions of the IT region of interest (size, laterality, exclusion of category-sensitive regions), see Figures S9–S11. RDMs were averaged across two sessions for each of four subjects. Monkey data are from 674 IT single cells isolated in two monkeys (left IT in one monkey, right in the other; Kiani et al., 2007).

