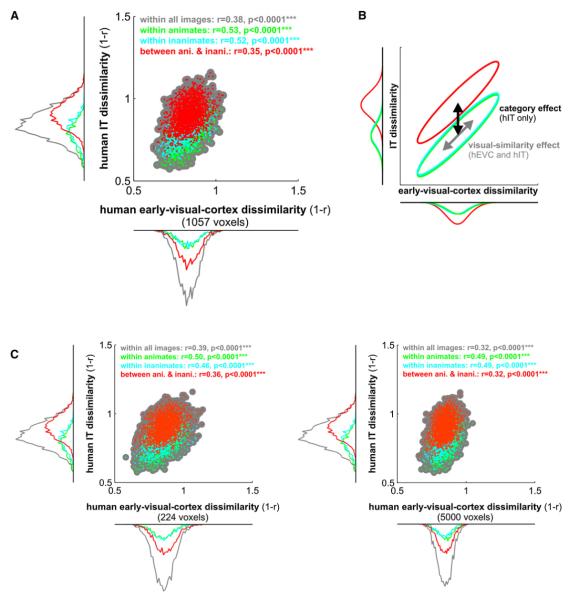
Figure 6. Representational Connectivity between Early Visual Cortex and IT in the Human.
(A) For each pair of stimuli, we plot a dot with horizontal position reflecting early visual response-pattern dissimilarity and vertical position reflecting IT response-pattern dissimilarity. Scatter plots and correlation analyses (insets) show that pairs of stimuli eliciting more dissimilar response patterns in early visual cortex also tend to elicit more dissimilar response patterns in IT. This suggests that visual similarity as reflected in the early visual representation carries over into the IT representation. However, IT additionally exhibits a strong category-boundary effect: when a stimulus pair crosses the animate-inanimate boundary (red) the two response patterns tend to be more dissimilar than when both stimuli are from the same category (green, cyan). The category-boundary effect is evident in the marginal dissimilarity histograms framing the scatter plot (for statistical analysis, see Figure 5).
(B) In this conceptual diagram, the distributions from the scatter plots are depicted as ellipsoids (iso-probability-density contours) with the same color code. The visual-similarity effect is shared between early visual and IT representations (each distribution diagonally elongated), whereas the category-boundary effect is only present in IT (red distribution vertically, but not horizontally shifted with respect to the within-category distributions).
(C) The same analyses for smaller and larger definitions of human early visual cortex (224 and 5000 voxels, respectively) show that the findings above do not depend on the size of the early visual region of interest.

