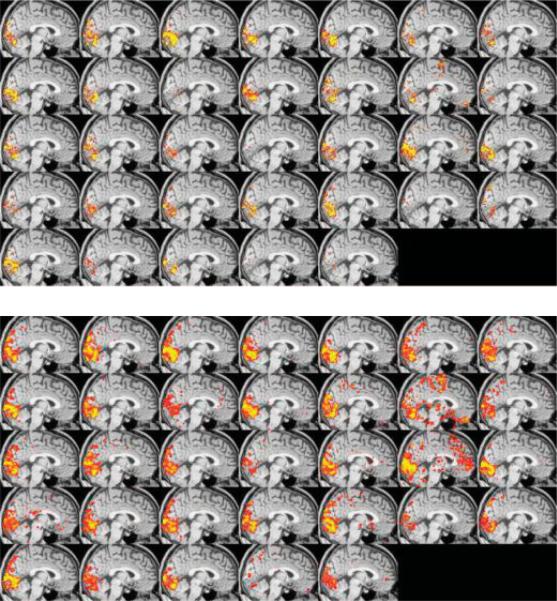
Fig. 1.
Used with permission from Smith et al. showing that the apparent variability in the fMRI data is a function of the threshold level. At a high threshold, the variability appears substantial as the center of mass of the visual activation moves considerably from session to session. With a lower threshold, it is clear that the general area of activation remains relatively constant.

