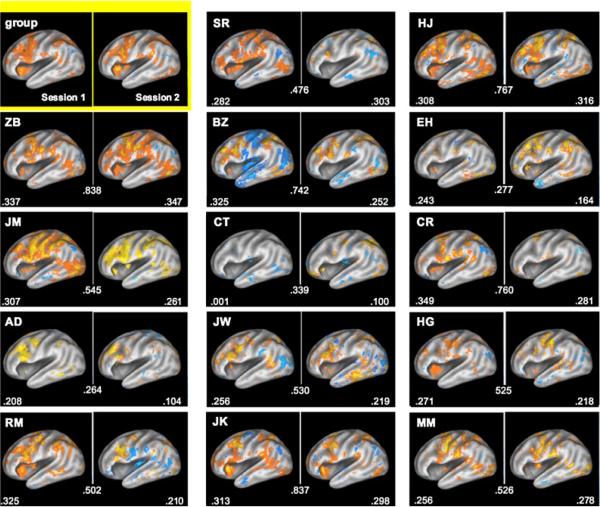
Fig. 2.
Used with permission from Miller et al. [99]. This shows left hemisphere activations and deactivations for a group of 14 individuals during a working memory task (contrast is retrieval vs. baseline). On the upper left is the group-averaged map across both sessions. Displayed for each individual is the spatial correlation between the two sessions (number in the middle), and the average spatial correlation between each subject's activation map and every other subject's activation map. This clearly shows that the temporal variability within each subject is much lower than across subject.

