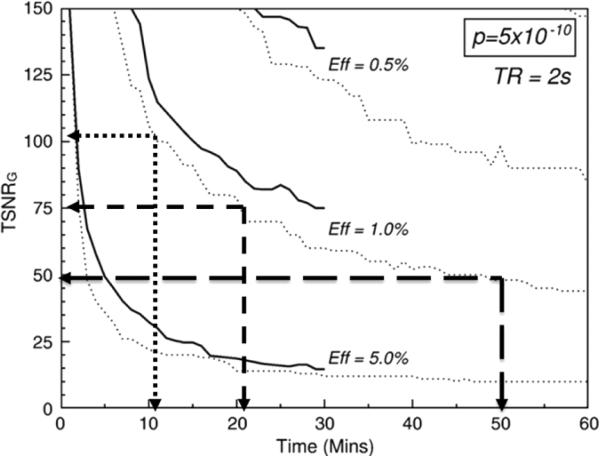
Fig. 7.
Used with permission from Murphy et al. [106]. This shows the relationship between temporal signal to noise (y-axis) and necessary time to scan to achieve a functional image with a sufficient p value, shown top right corner. The three curves are for different effect sizes. If one is working at a temporal signal to noise of 50 (typical for high resolution fMRI at 7T) it would take about 50 minutes to perform enough temporal averaging to create a sufficient image. If the temporal signal to noise is increased by 50%, the time is reduced to just over 20 minutes. If temporal signal to noise is doubled, the time is reduced by a factor of 5 to a very manageable 10 minutes.

