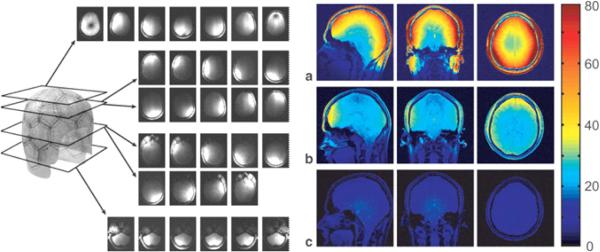
Fig. 8.
Used with permission from Wiggins et al. [148], showing, on the left, uncombined images for the 32-channel coil from a gradient-echo scan obtained with all elements active, demonstrating isolation between all of the coil elements at 3T. As the coils are distributed in 3D, their sensitivity profiles must be visualized by viewing the images in different planes that pass through different rows of coils. On the right are signal to noise maps derived from gradient-echo scans for (a) a 32-channel coil, (b) a commercial eight-channel coil, and (c) a commercial volume coil. All maps are generated with the same color scale.

