Abstract
The non-stationary nature and variability of neuronal signals is a fundamental problem in brain-machine interfacing. We developed a brain-machine interface to assess the robustness of different control-laws applied to a closed-loop image stabilization task. Taking advantage of the well-characterized fly visuomotor pathway we record the electrical activity from an identified, motion-sensitive neuron, H1, to control the yaw rotation of a two-wheeled robot. The robot is equipped with 2 high-speed video cameras providing visual motion input to a fly placed in front of 2 CRT computer monitors. The activity of the H1 neuron indicates the direction and relative speed of the robot's rotation. The neural activity is filtered and fed back into the steering system of the robot by means of proportional and proportional/adaptive control. Our goal is to test and optimize the performance of various control laws under closed-loop conditions for a broader application also in other brain machine interfaces.
Keywords: Neuroscience, Issue 49, Stabilization reflexes, Sensorimotor control, Adaptive control, Insect vision
Protocol
1. Fly Preparation
The first step in setting up the experiments involves preparing the fly so that no involuntary motion corrupts the stability of the neuronal recordings and that the head of the fly is correctly oriented with the visual stimulation equipment. To begin preparing the fly, cool it on ice and then use blunted cocktail sticks to hold the wings down, and fix the back of the fly to a piece of double-sided-tape on a microscope slide.
Next, use an electro-cauterizing needle to apply bees wax to attach the wings to the slide and also to block the action of the flight motor. This step requires quick and accurate handling so that the fly does not warm up during the procedure.
Now under the microscope, hold each leg with forceps and use a pair of small scissors to cut them off at the joints closest to the body. Repeat this for the proboscis. To prevent the fly from drying out, the holes must be sealed with wax.
Next, cut one of the wings off and then turn the fly on its side. Remove any remaining pieces of wing, while leaving the calyptra covering the halteres, and seal the hole with wax. Repeat this procedure for the other wing.
To stimulate a target neuron in a defined way, the fly's head has to be properly aligned with the computer monitors. To do this, you will need a customized holder that has a broad space for the fly's body and an appendage on one end with a notch cut where the fly's neck will be placed.
Place the fly onto the holder with its neck in the notch, pressing it down while gluing the abdomen in place. Now place the fly holder in a stand so that you can see the front of the fly's head through the microscope.
Viewing the fly with red light, an optical phenomenon called the pseudo-pupil can be seen in each eye. The pseudo-pupil provides a reference frame which can be used to align the fly's head with the stimulus (Franceschini 1975). If the pseudo-pupil assumes a certain shape, as shown by the image insert below, then the orientation of the fly's head is perfectly defined.

Use a micromanipulator to correctly orient the fly's head, and then use wax to glue it to the holder.
Next, Press the thorax down flat and wax it to the holder. This allows the rear head capsule to be opened so that electrodes can be inserted into the fly brain.
Use a micro scalpel or a fine injection needle to carefully cut a window into the cuticle of the right head capsule. Be careful not to cut the neural tissue right underneath the cuticle. Once the piece of cuticle is removed, add a few drops of Ringer solution.
Use forceps to remove any floating hairs, fat deposits, or muscle tissue that may cover the lobula plate. The lobula plate can be identified by a characteristic branching pattern of silvery trachea that covers its posterior surface.
Cut a small hole into the cuticle of the left rear head capsule for positioning a reference electrode. With the fly prepared, lets see how to position the recording electrode.
2. Positioning the Recording Electrode
With the fly prepared, let’s proceed to locating and recording signals from the H1 neuron. The recording electrode must be placed in close proximity to the H1 neuron. The H1 neuron mainly responds to horizontal back-to-front motion presented to its receptive field (Krapp et al. 2001).
To position the recording electrode, use the trachea as a visual landmark. Initially, place the electrode between the uppermost trachea.
It helps to use an audio amplifier to convert the recorded electrical potentials into acoustic signals. Each individual spike is turned into a characteristic clicking sound. The closer the electrode gets to an individual neuron, the clearer the clicking sound becomes.
To identify the H1 neuron by means of its motion preference, stimulate it with motion in the horizontal direction. With the recording electrode in place, lets move on to visual stimulation and recordings.
3. Visual Stimulation and Recordings
The closed-loop experiments are setup such that such that stimulation of the H1 neuron results in the robot compensating for the movement of the turn-table. To begin, place a fly in front of two CRT computer monitors. Because the fly visual system is 10 times faster than the human’s, the monitors must display 200 frames per second. The monitors and other electrical equipment must be electromagnetically shielded to minimize external noise in the measured neuronal signal.
Position the centres of the monitors at +/- 45 degrees relative to the fly's orientation. As seen from the fly's eye equator, each monitor subtends an angle of +/-25 degrees in the horizontal, and +/-19 degrees in the vertical plane.
Synchronized input to the computer monitors is provided by two video cameras mounted on a small, two-wheeled ASURO robot that has been modified for the experiment.
Position the robot on a turn-table within a cylindrical area whose walls are lined with a pattern of vertically oriented, black and white stripes. By rotating the turn-table in the horizontal plane, the movements of the robot are limited to only one degree of freedom.
Initially both the turn-table and robot are at rest. When the turn-table starts moving, its rotation carries the robot, in the same direction and the video cameras record the relative motion between the robot and the striped pattern of the arena.
The battery-powered video cameras on the robot are mounted at an orientation of +/- 45 degrees. They capture 200 images per second to match the frame rate of the computer monitors in front of the fly.
Log the images presented to the computer monitors at 200 frames per second at a resolution of 640 x 480 (gray-scale).
While the fly is watching the movements of the striped pattern, record the band-passed filtered (for example, between 300 and 2 kHz) electrical signals with a Digital Acquisition board using a sampling rate of at least 10 kHz.
A threshold is applied to the band-passed filtered electrical signals to separate the spikes from the background activity. A causal, half-gaussian filter is convolved with the spikes to obtain a smooth spiking activity estimate for the H1 cell.
To close the loop of the brain machine interface, a control algorithm is used to convert the spike rate of the H1 cell to a robot speed which is fed back via a Bluetooth interface to control the two DC motors driving the wheels of the robot.
Pure sine waves are chosen as velocity profiles for the turn-table. The sine waves have a DC-offset such that the turn-table only rotates in the direction which stimulates the H1 neuron along its preferred direction. Stimulation of the H1 neuron results in the robot compensating for the movement of the turn-table.
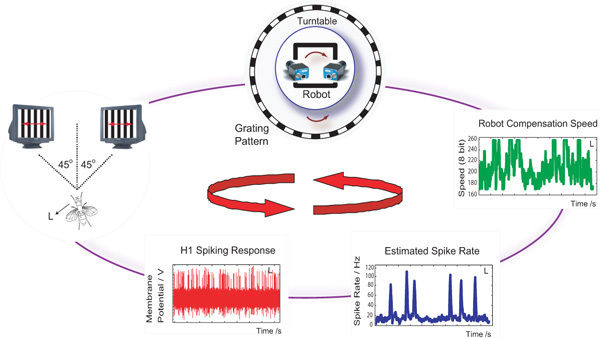 Figure 1: Closed loop setup. In our setup, spiking activity of the left H1 cell is used to control the motion of a robot mounted on a turntable. Visual image motion generated as a result of relative motion between the robot and the turn-table is captured via high-speed cameras and displayed on two CRT monitors in front of the fly. H1 spiking activity from the left hemisphere is used to estimate the real-time spike rate which then uses a control law to calculate a compensation speed for the robot. The robot counter-rotation stabilizes the visual image motion observed by the fly during closed-loop control.
4. Representative Outcome and Results
When set up correctly, visual stabilization is achieved when the counter-rotation of the robot matches the rotation of the turn-table, resulting in little or no pattern movement on the computer monitors. The overall performance of the system depends on the control algorithm being used to close the loop.
The first algorithm we test is a proportional controller (figure 2) where the updated robot speed is proportional to the difference in angular velocities between the robot, ωr, and the turn-table, ωp. Different values for the static gain, Kp, and input frequencies for the turn-table signal, ωp, are chosen to test the performance of the controller.
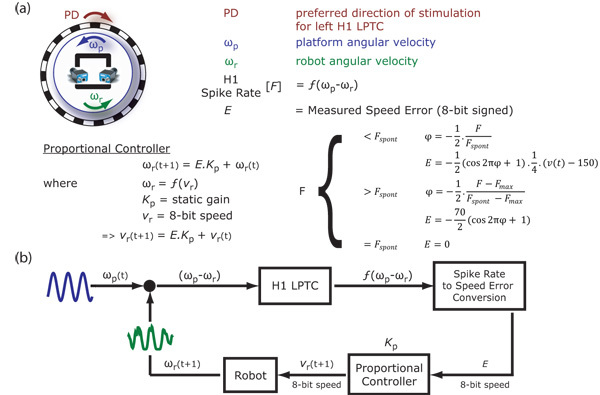 Figure 2: Proportional controller. (a) Relative motion between the robot and the turn-table in the preferred direction stimulates the H1 cell to give the spike rate, F. This spike rate is converted into a speed error, E, and a proportional controller is used to estimate the updated robot speed, vr(t+1). The spike rate, F, is converted to the speed error, E, based on whether it is less than or greater than the spontaneous spike rate, Fspont. The spike rate to speed error conversion is done by projecting F over a cosine (interval [π,0]) to account for spiking rate threshold nonlinearities. The constants 70 and 150 are used to match the 8-bit input speed of the robot to the minimum and maximum angular velocities of the turn-table. (b) Block diagram showing closed-loop system using a proportional controller. The input to the system is a sinosuidal modulation of the turn-table angular velocity, ωp(t), and the corresponding robot response ωr(t+1) is recorded.
Sample traces for ωp and ωr are shown here for Kp=1 and an input frequency of 0.6 Hz for ωp (see figure 3). The robot (in green) follows the turn-table (in blue) with a lag and a smaller peak-amplitude. The horizontal component of the pattern motion that stimulates the H1 cell is shown below (in red).
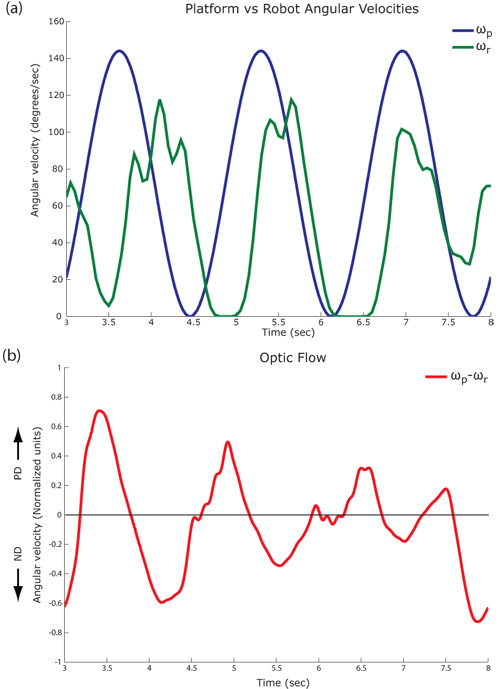 Figure 3: Closed loop responses. (a) Angular velocities for the turn-table (blue), ωp, and robot (green), ωr, at input frequency = 0.6 Hz. (b) Horizontal optic flow is shown as calculated from logged images (red). Pyramidal Lucas Kanade method (3 pyramid levels) is used to compute the optic flow field between successive image frames. Horizontal angular velocity is calculated by summing the projections of individual vectors in the flow fields onto the horizontal unit vector i. Horizontal back-to-front motion that excites the H1 cell is referred to as PD (preferred direction) while horizontal front-to-back motion that inhibits the H1 cell is referred to as ND (null direction).
Input frequencies for the turn-table signal, ωp, are chosen between 0.03-3 Hz and the corresponding robot signal, ωr, is recorded. Both signals are transformed into the frequency domain by a fast Fourier transform (see figure 4) and the amplitude and phase values are calculated at the input frequency.
 Figure 4: Frequency response. Angular velocity signals for the turn-table, ωp, and robot, ωr, are transformed into the frequency domain using the fast Fourier transform (FFT) method to calculate amplitude and phase components at the input frequency. Phase components of FFT are not shown in the figure.
The Bode magnitude plot for the proportional controller with Kp=1 shows the response of the system over the tested input frequencies (see figure 5-a). The performance of the controller generally decreases with increasing frequencies. The slightly increased gain at 1 Hz is as a result of oscillations in the robot signal due to using only one H1-cell whose dynamic (output) range mainly covers horizontal back-to-front motion.
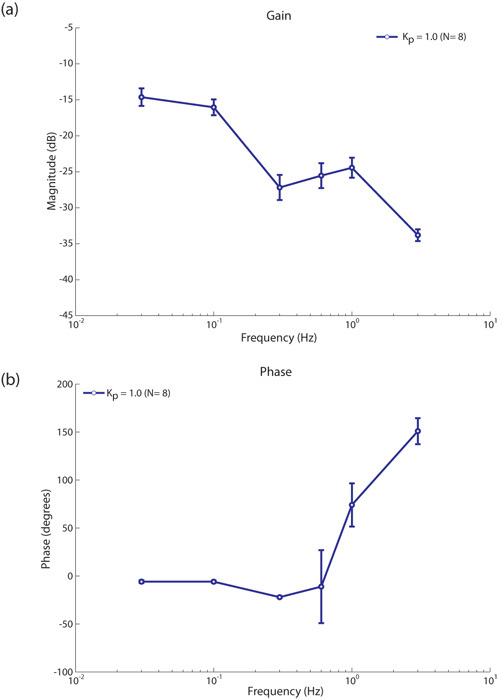 Figure 5: Proportional controller performance. The Bode magnitude and phase plots for the proportional controller (averaged over 8 flies), static gain Kp = 1.0 (a) the bode magnitude plot roughly follows a low pass filter characteristic. The slightly increased gain at 1 Hz is as a result of oscillations in the robot signal, ωr, due to using only one H1-cell whose dynamic (output) range mainly covers horizontal back to front motion. The number of oscillations in the robot signal, ωr, decrease with increasing input frequencies leading to slightly increased gain at these frequencies. (b) the Bode phase plot is less than 180° for input frequencies ≤ 1 Hz and approaches instability at 3 Hz. Beyond a certain input frequency, the controller becomes instable due to the kinematics of the robot. This instability only occurs beyond the known optimal response range of the fly visual system (Warzecha et al. 1999).
The Bode phase plot (see figure 5-b) shows a controller phase lag less than Π for input frequencies < 0.6 Hz. This shows that the controller is stable for frequencies < 0.6 Hz and unstable for input frequencies ≥ 1 Hz.
The performance of the proportional controller with a static Kp (in blue) was compared with an adaptive controller (in red), where the value for Kp is updated every 50 ms based on the peak spike rate, Fmax, calculated over time interval [t-500ms - t] (see figure 6). As a result of the large integration time window, the proportional controller performs better than the adaptive controller for the parameter range tested (see figure 7-a). The initial time integration window of 500 ms was chosen for technical reasons related to the robot platform we are using. The adaptive controller had a similar phase characteristic as the proportional controller (see figure 7-b).
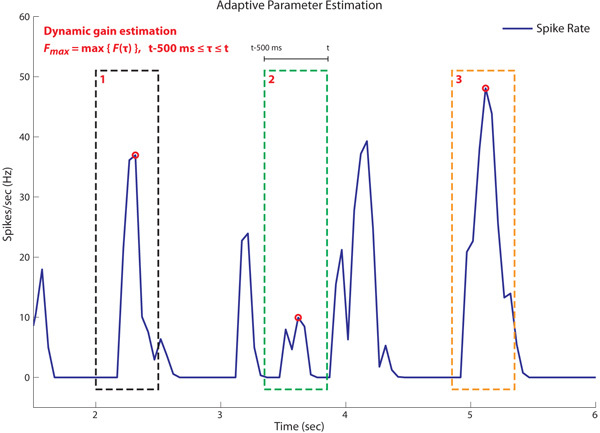 Figure 6: Adaptive controller gain. The proportional controller uses a static gain, Kp, whereas the adaptive controller estimates the gain continuously during closed loop control. The dynamic gain, Kp, is inversely proportional to the maximum spike rate, Fmax, over the interval t-500ms ≤ τ ≤ t. Figure shows three instances where Fmax is estimated over time. Based on estimated values of Fmax, Kp is highest during time window 2 (green) and lowest during time window 3 (orange).
 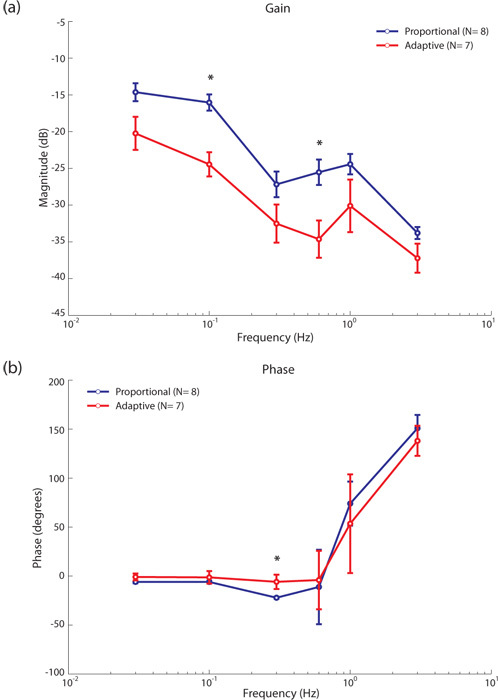 Figure 7: Proportional vs. adaptive controller. Bode magnitude and phase plots for the proportional (Kp = 1) and adaptive controller (a) the adaptive controller updates the value of Kp every 50ms based on the peak spike rate estimate Fmax over the last 500ms. The proportional controller gain plot (blue) is higher than that of the adaptive controller (red) indicating that it is performing better at all input frequencies. (b) the Bode phase plots for both controllers are similar with a significant difference at f = 0.3 Hz. Both controllers approach instability at 3 Hz. Significantly different gain and phase values are indicated by an asterix (Wilcoxon rank sum method, p = 0.05).
The grating pattern around the turntable was removed and the lab environment was used as an approximation of naturalistic visual input for the fly H1-cell. On average, the Bode magnitude plot (see figure 8-a) for the naturalistic visual input (in blue) showed slightly higher gains than the one with grating visual input (in red) probably because the wider range of spatial frequencies in naturalistic visual images is exploited. The Bode phase plot characteristics for grating vs naturalistic visual inputs were similar (see figure 8-b).
 Figure 8: Stripped pattern vs. lab environment. The Bode magnitude and phase plots for the proportional controller when presented with stripped patterns (red) vs lab environment (blue) visual images under closed loop (a) the Bode magnitude plot for when lab environment images are used is marginally higher than when stripped pattern is used (except at f = 0.1 Hz) indicating better performance under such stimulus. (b) the Bode phase plot under both visual conditions follow the same pattern, with both approaching instability at 3 Hz. Significantly different gain and phase values are indicated by an asterix (Wilcoxon rank sum method, p = 0.05).
Discussion
Fly dissection needs to be carried out carefully making sure that we correctly orient the fly with respect to the computer monitors.
Separating the spikes from the H1 neuron from the spikes from all other neurons to get a good signal to noise ratio which can then be used to control the robot reliably.
Care should be taken to prevent any neural tissue from drying out during the course of the experiment.
The cameras are connected to computers using an Ethernet cable. Care should be taken so that they are not over-wound during the experiment as that would affect the rotation of the robot.
Currently we are using the spike activity of one H1 to setup a stabilization task in only one direction of yaw rotation. We can add a second electrode to get signals from both left and right H1's so that we can study stabilization control algorithms in both directions of yaw rotation.
We can remove the arena containing the vertically oriented black and white stripes and use the lab environment as the visual stimulus for the fly. This will allow us to study closed-loop performance with naturalistic images.
The robot can be removed from the turn-table and allowed to move around the lab environment while in closed-loop control. This will allow us to investigate control algorithms involved in collision avoidance.
The wires connecting the cameras to the computers can be removed by implementing a wireless transmission system, giving us a completely unrestrained robotic setup.
The performance measures of the different control algorithms will give us an understanding of how different strategies are able to cope with non-stationary and variable neuronal signals. This knowledge can then be applied to different clinical and non-clinical brain-machine interfaces.
This experimental setup is the first step towards recording neuronal signals from behaving animals. Our goal is to place the fly on the robot and use its neural activity for closed-loop control. In such a setup, we would be able to record neural activity from the fly while it is receives multisensory stimulation as a result of the motion of the robot.
Record only signals from one cell. In the configuration we should you, the most suitable cell would be the H1-cell. Isolating the responses of the H1 neuron from other neurons with similar receptive fields, e.g. H2, is important to maintain a good signal to noise ratio for the neuronal recordings. The responses of the H1 and H2 neurons can be discriminated by noting that the H2 has characteristically lower spontaneous and mean spiking rate than the H1 neuron. The neurons can also be discriminated on the basis of their morphology (Krapp et al. 2001).
Our system allows us to compare the closed-loop gain achieved by our fly-robot interface on an image stabilization task, and to compare its performance with closed-loop optomotor gains observed in previous experiments on flies (Bender & Dickinson 2006, Warzecha et al. 1996, Heisenberg & Wolf, 1990). Additionally, it allows us to investigate state-dependant changes in visual information processing under closed-loop conditions (Chiappe et al. 2010, Maimon et al. 2010, Longden & Krapp 2009, Longden & Krapp 2010).
Acknowledgments
K. Peterson was supported by a PhD studentship from the Department of Bioengineering and funding from the US Air Force Research Labs.
N. Ejaz was supported by a PhD studentship from the Higher Education Commission Pakistan and funding from the US Air Force Research Labs.
References
- Chiappe EM, Seelig JD, Reiser MB, Jayaraman V. Walking modulates speed sensitivity in Drosophila motion vision. Curr. Biol. 2010;20:1470–1475. doi: 10.1016/j.cub.2010.06.072. [DOI] [PMC free article] [PubMed] [Google Scholar]
- Franceschini N. Sampling of the visual environment by the compound eye of the fly: fundamentals and applications. In: Snyder AW, Menzel R, editors. Photoreceptor optics. Berlin Heidelberg New York: Springer; 1975. pp. 98–125. [Google Scholar]
- Karmeier K, Tabor R, Egelhaaf M, Krapp HG. Early visual experience and the receptive-field organization of optic flow processing interneurons in the fly motion pathway. Vis. Neurosci. 2001;18:1–8. doi: 10.1017/s0952523801181010. [DOI] [PubMed] [Google Scholar]
- Krapp HG, Hengstenberg B, Hengstenberg R. Dendritic structure and receptive-field organization of optic flow processing interneurons in the fly. Jour. of Neurophys. 1998;79:1902–1917. doi: 10.1152/jn.1998.79.4.1902. [DOI] [PubMed] [Google Scholar]
- Krapp HG, Hengstenberg R, Egelhaaf M. Binocular contributions to optic flow processing in the fly visual system. Jour. of Neurophys. 2001;85:724–734. doi: 10.1152/jn.2001.85.2.724. [DOI] [PubMed] [Google Scholar]
- Longden KD, Krapp HG. Octopaminergic modulation of temporal frequency coding in an identified optic-flow processing interneuron. Frontiers in Systems Neuroscience. 2010;4:153–153. doi: 10.3389/fnsys.2010.00153. [DOI] [PMC free article] [PubMed] [Google Scholar]
- Bender JA, Dickinson MH. A comparison of visual and haltere-mediated feedback in the control of body saccades in Drosophila melanogaster. J. Exp. Bio. 2006;209:4597–4606. doi: 10.1242/jeb.02583. [DOI] [PubMed] [Google Scholar]
- Longden KD, Krapp HG. State-dependent performance of optic flow-processing interneurons. J. Neurophysiol. 2009;102:3606–3618. doi: 10.1152/jn.00395.2009. [DOI] [PubMed] [Google Scholar]
- Maimon G, Straw AD, Dickinson MH. Active flight increases the gain of visual motion processing in. 2010;13:393–399. doi: 10.1038/nn.2492. [DOI] [PubMed] [Google Scholar]
- Petrovitz R, Dahmen H, Egelhaaf M, Krapp HG. Arrangement of optical axes and spatial resolution in the compound eye of the female blowfly Calliphora. J Comp Physiol A. 2000;186:737–746. doi: 10.1007/s003590000127. [DOI] [PubMed] [Google Scholar]
- Warzecha AK, Horstmann W, Egelhaaf M. Temperature-dependence of neuronal performance in the motion pathway of the blowfly Calliphora Erythrocephala. J Exp Biology. 1999;202:3161–3170. doi: 10.1242/jeb.202.22.3161. [DOI] [PubMed] [Google Scholar]


