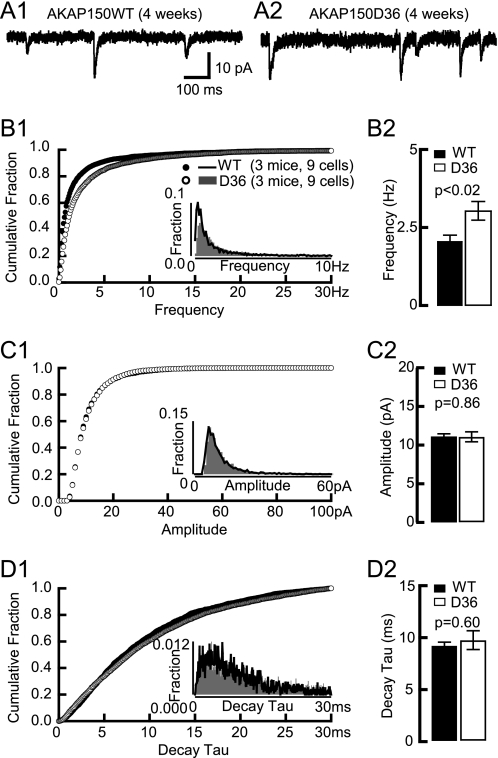
FIGURE 3.
AMPAR mEPSC in 4-week-old D36 mice. A, examples of AMPAR mEPSCs from acute hippocampal slices from 4-week-old litter mate WT (A1) and D36 mice (A2). Cumulative fraction (B1) and histogram distribution (inset) of mEPSC frequency show a right shift and the frequency averages (B2) are dramatically increased in 4-week-old D36 (3.1 ± 0.3 Hz) versus WT mice (2.1 ± 0.2 Hz; p < 0.02). Cumulative fraction (C1) and histogram distribution (inset) of mEPSC amplitude are unchanged in 4-week-old D36. The amplitude average (C2) is comparable between D36 (11.1 ± 0.6 pA) and littermate-matched WT (11.1 ± 0.3 pA). Cumulative fraction (D1) and histogram distribution (insert) of mEPSC decay tau is not significantly changed in 4-week-old D36. The decay tau average (D2) is comparable between D36 (9.6 ± 0.9 ms) and WT (9.1 ± 0.3 ms). p values of Mann-Whitney test are shown in each subpanel.

