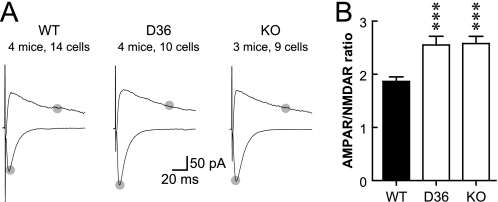
FIGURE 5.
Increase in the ratio of AMPAR- to NMDAR-mediated EPSCs in 3-week-old AKAP150 KO and D36 mice. A, example traces of EPSC at −70 and +50 mV. Gray dots indicate the time points that were used to determine the magnitudes of EPSCs for AMPAR (bottom) and NMDAR (top). B, AMPAR/NMDAR EPSC ratio is increased in D36 (2.55 ± 0.16) and KO (2.58 ± 0.13) mice compared with WT controls (C57BL/6, 1.86 ± 0.08; one-way ANOVA, p = 0.0002; ***, post-hoc Bonferroni's multiple comparison with WT, p < 0.001).

