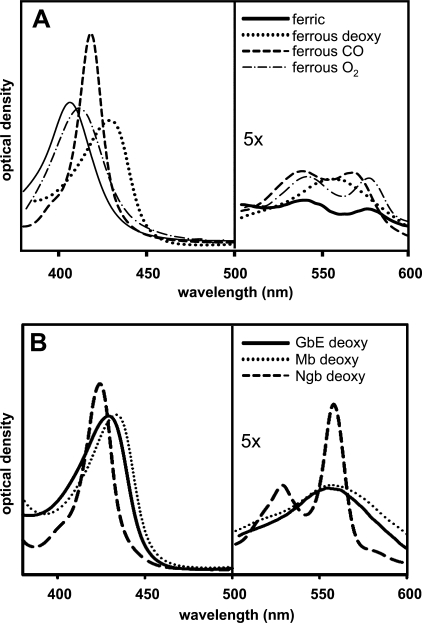
FIGURE 4.
Absorbance spectra of GbE. A, spectral forms of ferric (solid line), ferrous deoxygenated (dotted line), ferrous CO-form (dashed line), and ferrous oxygenated (dot-dash line) of recombinant GbE were read from 380 to 600 nm. The protein concentration was ∼0.15 mg/ml. B, comparison of spectra of deoxygenated GbE (solid line), Mb (dotted line), and Ngb (dashed line).

