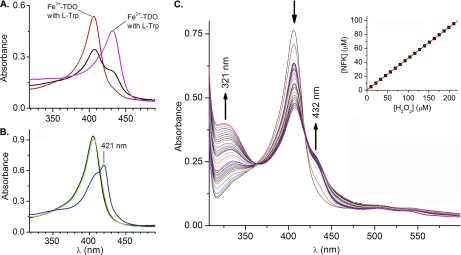
FIGURE 4.
Optical spectra of TDO. A, Soret bands of ferric and ferrous CmTDO (5 μm) in the presence of l-Trp (5 mm) are observed at 406 and 432 nm, respectively. The Soret band of the ferric sample splits into two parts 30 s after addition of H2O2 (30 μm). B, ferric TDO (black), after sequential addition of l-Trp (red), CO (green), and H2O2 (blue). The red and green traces are nearly identical to each other. C, optical spectra of TDO and l-Trp taken from the sequential additions of equal amount of H2O2 (see text for experiment details). The inset is the calculated NFK concentration as a function of the added H2O2 under anaerobic conditions. The concentration of H2O2 was determined using ϵ240 nm = 43.6 m−1 cm−1. NFK concentration was determined using ϵ321 nm = 3150 m−1 cm−1 after subtraction of the initial spectrum.

