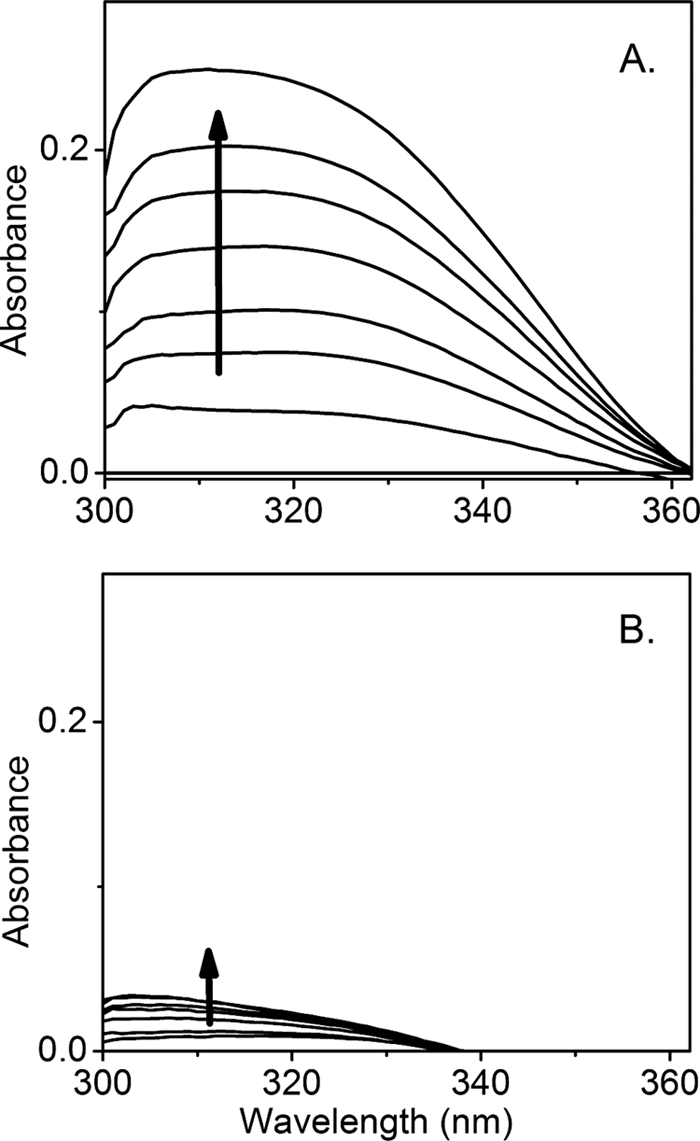
FIGURE 5.

Formation of NFK as a result of the peroxide reaction with ferric TDO (5 μm) and l-Trp (5 mm). The spectra were taken from the anaerobic titration of 35 eq of H2O2 (total 175 μm) in the absence (A) and presence (B) of hydroxyurea (10 mm). Each trace was obtained after the reaction was complete and subtracted against a spectrum of ferric TDO at the same concentration (5 μm).
