FIGURE 7.
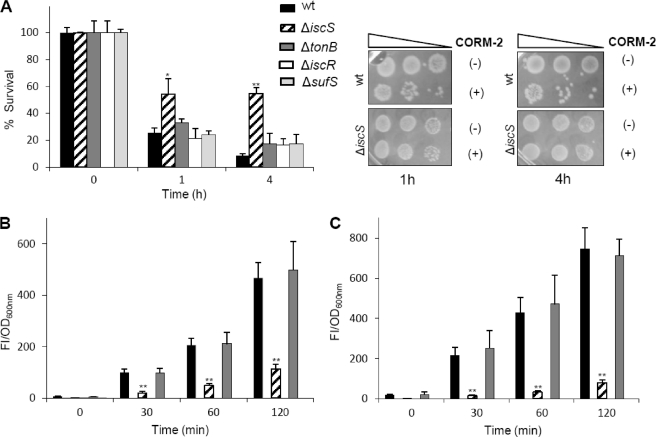
CORM-2 efficiency depends on iron-sulfur cell content. A, viability of E. coli parental strain (black bars), ΔiscS (striped bars), ΔtonB (dark gray bars), ΔiscR (white bars), and ΔsufS (light gray bars) determined upon exposure to 150 μm CORM-2 and iCORM-2, for 1 and 4 h. Sensitivity tests were also performed in ΔiscS cells treated with CORM-2 (+) and iCORM-2 (−) for 1 and 4 h. ROS intracellular content evaluated in the parental strain (black), ΔiscS (striped), and ΔtonB (dark gray) upon exposure for 1 (B) and 4 h (C) to 150 μm CORM-2 and iCORM-2. The FI represent the subtraction of the cultures treated with iCORM-2 from cultures treated with CORM-2 normalized in relationship to OD600 nm of the respective culture. The error bars are the mean ± S.E. of the average values obtained from two independent biological samples performed in duplicate (*, p < 0.05; **, p < 0.01).

