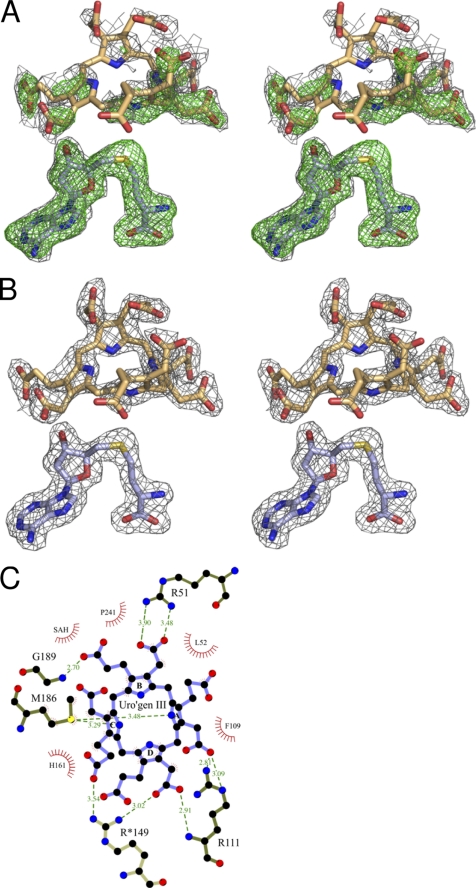
FIGURE 4.
Substrate binding site of NirE. A, stereo view of the omit maps of SAH and uro'gen III calculated in the absence of the substrates from the final structure model. The 2Fo − Fc map is contoured to 1 σ and represented by a black mesh. The Fo − Fc map is contoured to 3 σ and represented by a green mesh. B, stereo view of the 2Fo − Fc map of SAH and uro'gen III calculated in the presence of the substrates shown as black mesh contoured to 1 σ. C, schematic representation of interactions between NirE and uro'gen III. Polar interactions are drawn as green broken lines with their lengths given in angstroms. Residues/atoms involved in hydrophobic contacts are surrounded by a red corona.

