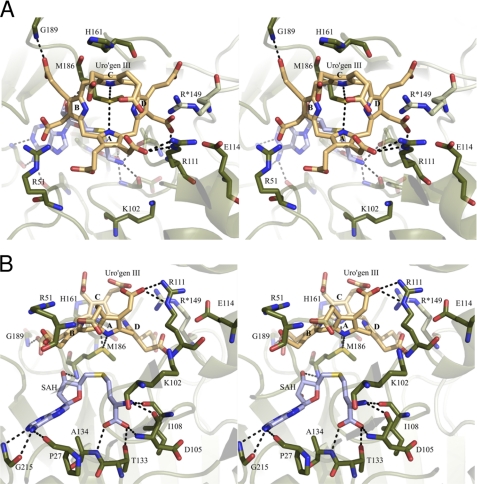
FIGURE 5.
Active site of NirE. Stereo top view (A) and stereo side view (B) of the NirE active site are shown. The protein chain is represented schematically; important amino acids are shown as sticks. The chain of monomer A is dark green and that of monomer B light green. The hydrogen bonds and salt bridges are drawn as black broken lines.

