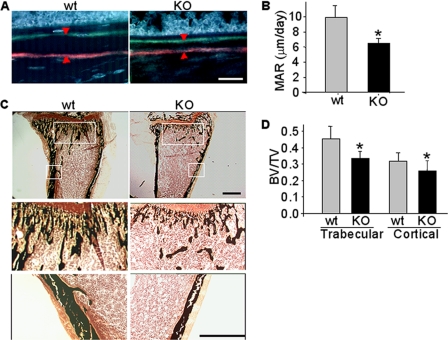
FIGURE 5.
Decreased MAR in Osx::CXCR4fl/fl mice. A, double fluorochrome-labeling in tibiae of Osx::CXCR4fl/fl mice (KO) and Cre-null littermate controls (WT) by xylenol orange (orange-red) and tetracycline (green) in a 4-day time interval. The scale bar equals 100 μm. B, the distance between two fluorochrome-labeled mineralization fronts (indicated by arrowheads in A) at the midshaft of tibia was quantified using OsteoII software (Bioquant). The MAR was calculated by dividing the measured distance by the time interval. C, von Kossa staining of the fluorochrome-labeled tibiae (upper panel; scale bar equals 500 μm). Mineralized trabecular or cortical bone (amplification of framed areas) is stained black (lower panels; scale bar equals 500 μm). D, histomorphometric analysis for mineralized bone in von Kossa-stained tibiae. The trabecular BV/TV was determined by dividing the area of mineralized trabecular bone by the total area from the epiphyseal growth plate to the midshaft of tibia. The cortical BV/TV was determined at the midshaft of tibia by dividing the cortical thickness by the total width of tibia. Five measurements per section for three consecutive sections were taken to average each sample. n = 5 (females; 2 weeks old) WT or KO mice. Measurements are presented as mean ± S.D. *, p < 0.05 versus WT control.

