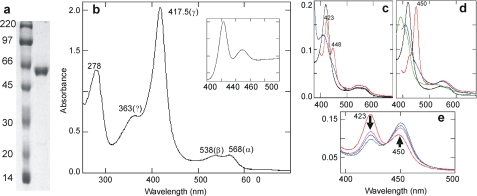
FIGURE 2.
Purified L. infantum CYP51. a, 12% PAGE, left lane, rainbow marker (Amersham Biosciences); right lane, L. infantum CYP51 after CM-Sepharose. b–e, absolute absorbance spectra of L. infantum CYP51. b, oxidized ligand-free (17.4 μm) (inset, its reduced CO difference spectrum); c, reduction (blue) and CO complex formation (red) in a ligand-free state (black), 1.7 μm; d, reduction (blue) and CO complex formation (red) after substrate binding (green) to the ligand-free enzyme (black), 1.7 μm; e, P450 recovery when the substrate is added to the reduced CO complex (red curve in c). The arrows show the directions of changes over time.

