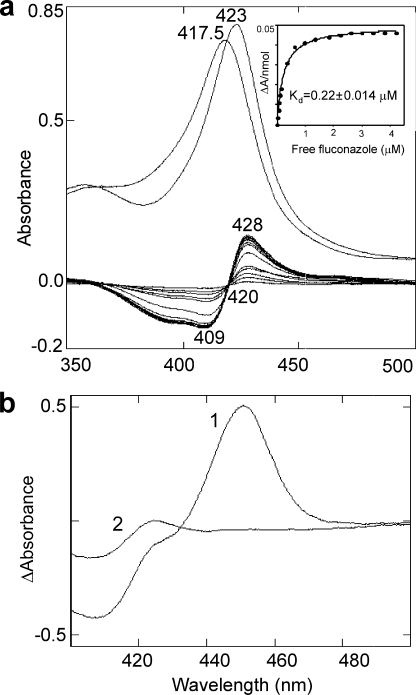
FIGURE 3.
Interaction of L. infantum CYP51 (6.1 μm) with fluconazole. a, upper spectra, absolute absorbance in the Soret band region (417.5 nm, no ligand; 423 nm, plus 30 μm fluconazole). Lower spectra, difference spectra (type II response) upon titration with fluconazole. The inhibitor concentration range is 0.5–30 μm. Inset, the titration curve. b, CO difference spectra in the presence of a 2.5-fold molar excess of Nls (spectrum 1) and after addition of a 10-fold molar excess of fluconazole to spectrum 1 (spectrum 2). Absolute CO binding spectra are shown in supplemental Fig. S6.

