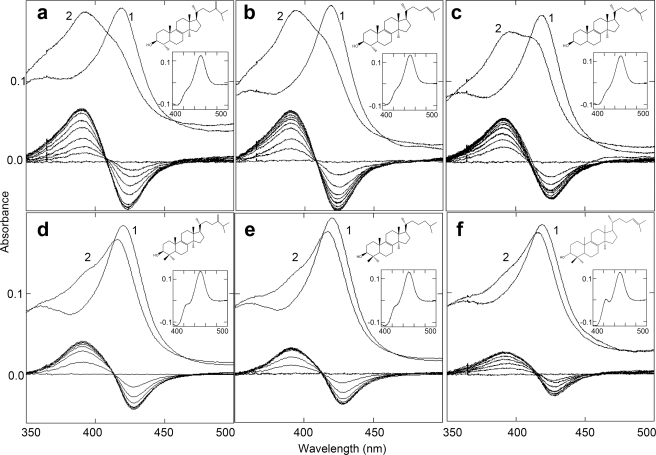
FIGURE 4.
Interaction of L. infantum CYP51 (1.5–1.6 μm) with sterol substrates. The ranges of sterol concentrations are 0.25–3.0 μm (0.25 μm increments) for Obt (a), Nls (b), and Mzs (c) and 0.5–5.0 μm (0.5 μm increments) for Ebr (d), Dhl (e), and Lns (f). In each panel, the upper spectra show the absolute absorbance in the Soret band region. Spectrum 1, ligand free; spectrum 2, after saturation with the sterol substrates. Lower spectra, difference spectra (type I response). Insets, reduced CO difference spectra; the corresponding sterol structures are shown.

