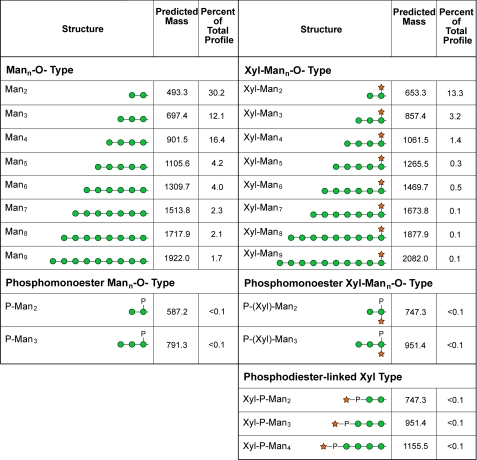
FIGURE 6.
The mass and prevalence of individual O-linked glycans detected in detergent-extracts of C. neoformans. Protein samples for glycan analysis were prepared from KN99α cells as described under “Experimental Procedures.” After release from protein material by reductive β-elimination, alditols were permethylated and characterized by NSI-MSn as their sodiated structures. Monoisotopic m/z values are given for the permethylated alditol forms of the indicated structures. The prevalence of each glycan is expressed as a percent of the total O-linked glycan profile quantified by measuring signal intensities from full MS spectra. Prevalence values are determined from complete TIM analysis of a single KN99α extract. A prevalence value of <0.1% of total profile indicates that the glycan was detected and characterized by MSn but was present at a level below the threshold for quantification (less than two times background).

