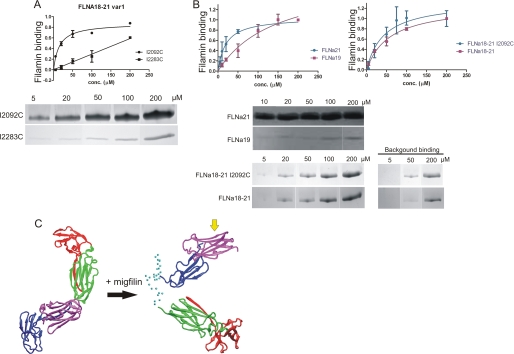
FIGURE 9.
Migfilin binding to FLNa(19), FLNa(21), FLNa(18–21), and FLNa(18–21) var-1. A, binding assays show that in FLNa(18–21) var-1 the binding site at FLNa(19) is lost. Migfilin peptide (5–19) binding to FLNa(18–21) var-1 I2092C and I2203C mutants in 5, 20, 50, 100, and 200 μm concentrations is shown. FLNa(18–21) var-1 I2092C and I2203C mutants binding to migfilin was quantified by protein staining and expressed as filamin binding (in arbitrary units) calculated as the ratio of filamin bound to filamin in the loading control, normalized to maximal filamin binding in each experiment (mean ± S.E. (error bars); n ≥ 4). Background binding is subtracted from the picture. B, binding assays show that the both binding sites at FLNa(19) and FLNa(21) are masked in FLNa(18–21), but migfilin can displace the masking β-strands and bind to FLNa(18–21). Binding is quantified as in A. C, SAXS-based model of FLNa(18–21) with migfilin bound. Right shows FLNa(18–21) before migfilin binding, and left is when migfilin is bound. FLNa(18) is shown in red, FLNa(19) in green, FLNa(20) in blue, and FLNa(21) in magenta. Cα atoms of unstructured regions are shown as cyan spheres. The migfilin binding site at the CD-face of FLNa(21) is shown with a yellow arrow.

