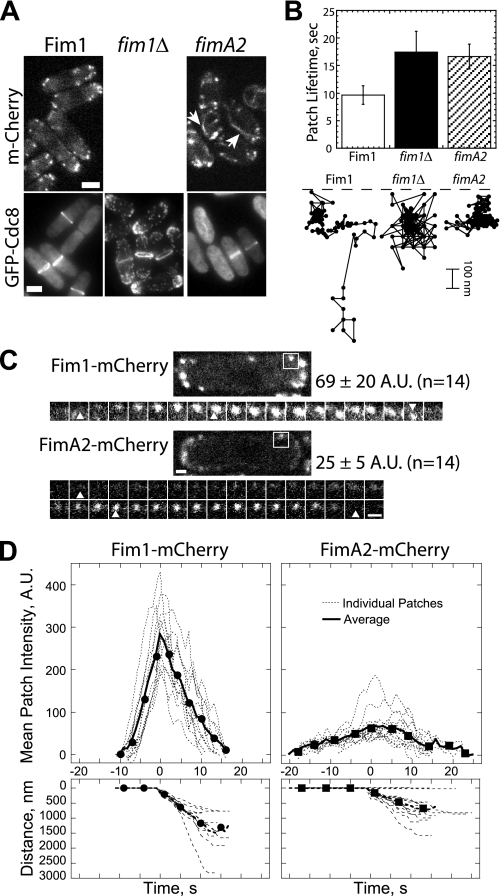
FIGURE 6.
The cross-linking activity of fimbrin is important for endocytic actin patches. A, top, fluorescence micrographs of mCherry-tagged full-length Fim1 or fimbrin fragment FimA2. Arrows indicate actin cable-like association of FimA2. Bottom, tropomyosin GFP-Cdc8 in cells expressing full-length Fim1-mCherry or fimbrin fragment FimA2-mCherry or fim1Δ cells. Bars, 5 μm. B, actin patch dynamics of cells expressing the general actin marker GFP-CHD(rng2). Corresponding supplemental Movie S12 is available online. Top, plot of actin patch lifetime for full-length fim1, fim1Δ, and fimA2 cells (n = 30 patches for each strain). Bottom, the position over time (0.075 s between positions) for representative full-length fim1, fim1Δ, and fimA2 actin patches. Dashed lines indicate cell cortex. C and D, comparison of the dynamics of Fim1-mCherry and FimA2-mCherry in actin patches. C, fluorescent micrographs of cells expressing Fim1-mCherry (top) and FimA2-mCherry (bottom) and the corresponding montages of a time series of a single actin patch (white boxes) at 1 frame/s. Numbers to the right are mean total cell fluorescence intensities (±S.D.). Arrowheads mark patch appearance, initiation of movement, and disappearance. Bars, 1 μm. D, individual patch (thin dashed lines) and average patch (thick lines) time courses of fluorescence intensity (top) and distance moved (bottom) for 12 Fim1-mCherry (left) and 14 FimA2-mCherry (right) actin patches.

