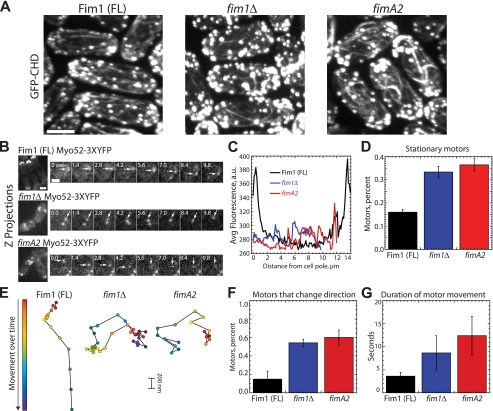
FIGURE 7.
Actin cable integrity is likely impaired in cells lacking full-length fimbrin. A, comparison of actin cables in full-length (FL) Fim1-mCherry, fim1Δ, and fimA2 cells. Maximum intensity projections of a Z-series through cells expressing the general actin filament marker GFP-CHD(rng2). Bar, 3.5 μm. B, left, maximum intensity Z projections of Myo52–3×YFP distribution in full-length Fim1-mCherry, fim1Δ, or fimA2 cells. Right, time-lapse micrographs of Myo52–3×YFP particles in full-length Fim1-mCherry, fim1Δ, or fimA2. Seconds are indicated at the upper left. Bar, 1 μm. Corresponding supplemental Movie S13 is available online. C, Myo52–3×YFP fluorescence value distribution across the length of interphase cells (n = 25 for each strain). Bar, 5 μm. D, the fraction of Myo52–3×YFP particles that remain stationary throughout their lifetimes in full-length Fim1-mCherry, fim1Δ, or fimA2 cells (n = 25 particles for each strain). Values are the mean ± S.D. E, the position over time (0.8 s between marks) for representative Myo52–3×YFP particles. Patch start position is indicated in red, and end position is indicated by blue/violet. F, the fraction of Myo52–3×YFP moving particles that change direction in full-length Fim1-mCherry, fim1Δ, or fimA2 cells (n = 25 for each strain). Values are the mean ± S.D. G, the average duration of Myo52–3×YFP particle movement in full-length Fim1-mCherry, fim1Δ, or fimA2 cells (n = 25 for each strain). Values are the mean ± S.D.

