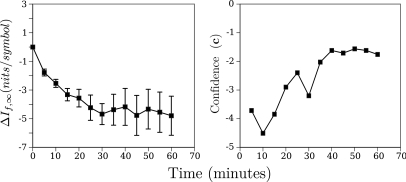
Figure 11.
(Color online) Average time course of images obtained from the five MDA435-implanted mice injected with -targeted nanoparticles and the corresponding confidence ratios (c) as a function of time post-injection. The left panel is the same panel appearing in the top right column of Fig. 10.

